
Beyond 1.5C: A Pathway-by-Pathway Comparison of UNEP's Overshoot Report — Trade-Offs, Scenarios and Next Steps
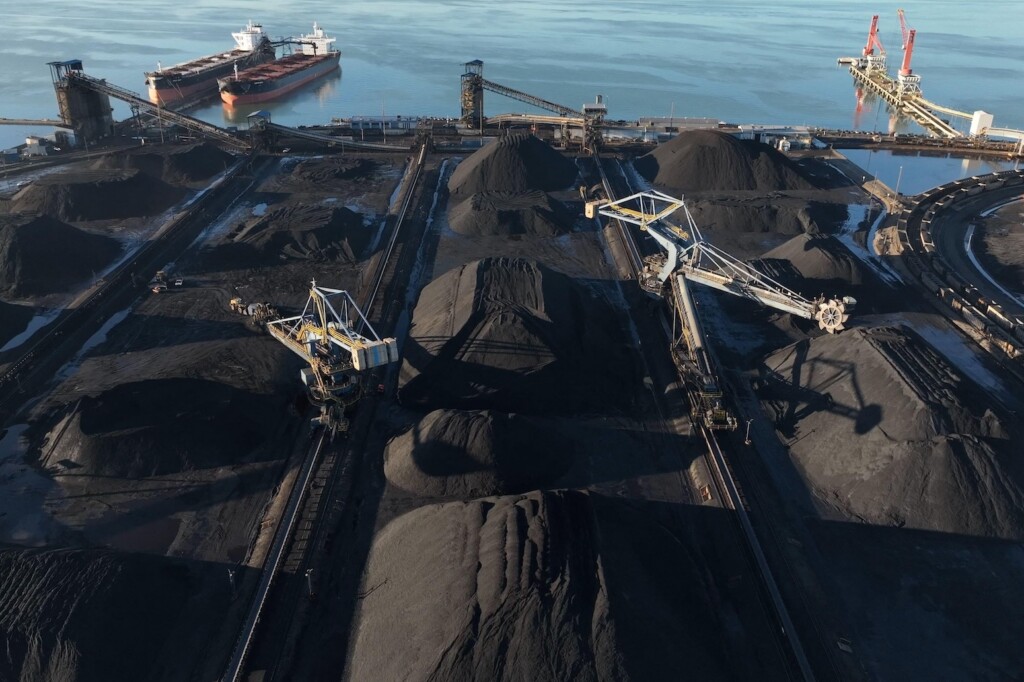 Aerial view of a coal port in Virginia, US. Credit: Nathan Wenger / Alamy Stock Photo
One word carries the headline — inevitable — but the document behind it is really a catalogue of priced options. The UN Environment Programme (UNEP) has concluded that a temporary breach of the 1.5C global-warming limit is now inevitable after decades of insufficient climate action, and that the chance of staying on the safe side of the line has been lost. Its annual emissions gap assessment, published under the title The point of return, makes for a sobering read without being a surrender note: the task now, in the agency's framing, is to shrink the overshoot and to establish a credible return path to 1.5C by the end of the century.
Once overshoot becomes the baseline rather than the risk, climate policy stops looking like pass or fail and starts looking like a product lineup — different pathways, different cuts, different volumes of carbon dioxide removals, different exposure profiles. That comparison is the most usable thing a general reader can extract from this year's release, so it sets the frame below: scenarios side by side, trade-offs named, misreadings corrected, and a decision checklist at the end.
Bottom line, in five points
- Even the lowest possible overshoot scenario sees warming crest near 1.7-1.8C in the middle of the century before turning down, and remains still aligned with the long-term temperature goal of the Paris Agreement.
- Buying that pathway requires global emissions cuts of 18% by 2030 and 45% by 2035, together with a sharp ramp-up of CO2 removals.
- The pledges governments have actually made, delivered in full, buy only 5-8% by 2030 and 11-15 % by 2035 against 2025 levels.
- UNEP still finds ample opportunity to accelerate action, concluding that countries can still limit peak warming, shorten the duration of overshoot and keep the goals of the Paris Agreement within reach.
- Speed is the cheapest asset left: every five years of hesitation locks in roughly another 0.1C.
Priced pathways: how the six futures stack up
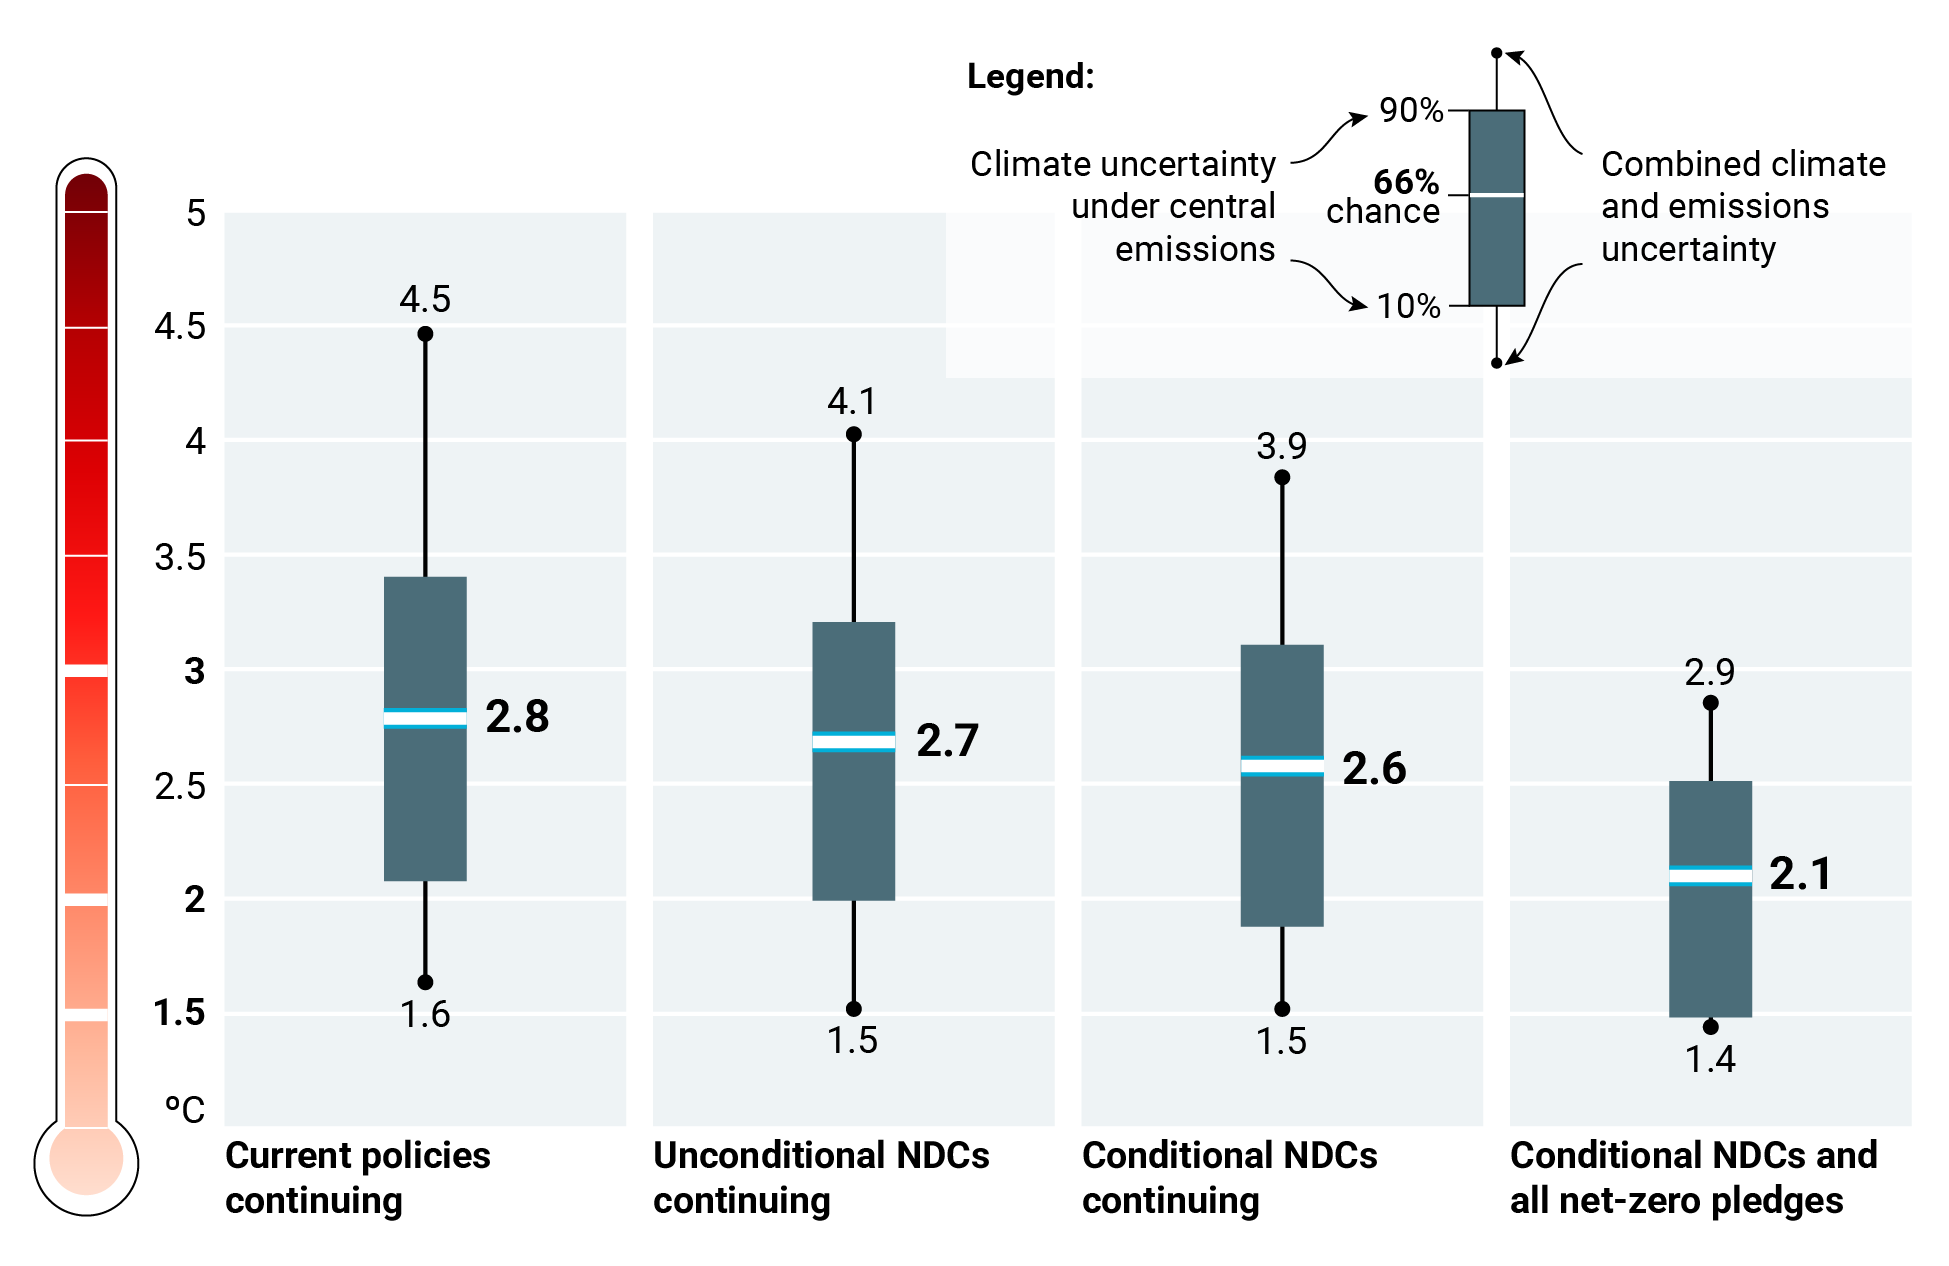
To convert pledges into degrees, the assessment uses FaIR, a simple climate emulator that translates emissions projections into likely warming by 2100. Read the results as tiers on a subscription plan: each tier you climb costs more politically and stores less heat physically.
| Pathway | Warming by 2100 | What it assumes | Core trade-off | Best analytical use |
|---|---|---|---|---|
| Current policy scenario | 2.8C, 66% chance; a 10% chance of exceeding 3.4C | Only policies adopted and implemented as of November 2025 | Cheapest to run today, dearest in damages later | The realistic worst-case yardstick |
| Unconditional NDCs | 2.7C, 66% chance | Full delivery of pledges that need no external support, cut-off 1 September 2026 | Removes the finance argument but leaves most of the gap | Baseline for judging political will |
| Conditional NDCs — every pledge delivered | 2.6C, 66% chance | Adds pledges that depend on outside help, such as climate finance from wealthier countries | Rests on money transfers that have not yet arrived | Where the finance promise is tested |
| Conditional NDCs plus all net-zero pledges | 2.1C, 66% chance | The most optimistic scenario included; long-term strategies followed after 2035, excluding that of the US | Takes about 0.6C off, yet still lands 0.25C above the best overshoot pathway | Ceiling of what is currently promised |
| Below 2C pathway | Held below 2C through the 21st century, at least 66% chance | Global cuts of 11% by 2030, 24% by 2035 and 37% by 2040 from 2025 levels | Mid-cost option that still concedes Paris ambition | Pragmatic fallback benchmark |
| Lowest 1.5C overshoot pathway | Peaks at 1.7-1.8C, back at 1.5C by 2100 with 50% chance | Immediate, deep, rapid and sustained reductions: 18%, then 45%, then 69% by 2040 | Needs removals plus a 5.7% annual fall — even more rapid than the 5% yearly cut that avoiding overshoot required | The tier worth defending |
Two details matter when reading this table. Central warming estimates under the NDC scenarios came out roughly 0.2-0.3C higher than last year's edition — not because governments tightened targets, but because projected 2035 emissions rose and the historical baseline moved. And the chart below, taken from the report, shows the projections against each other; its right-hand panel displays the unbridgeable gap that now separates today's pledges from older pathways that limit warming to 1.5C with overshoot of no more than 0.1C.
Beyond the NDC scenarios sit two scenario extensions that carry the modelling past 2035: current policies continuing, which follows current policies to 2035 and assumes a continuation of similar efforts thereafter, and the conditional NDCs plus all net-zero pledges tier — the most optimistic scenario included, and the only one that prices in long-term strategies rather than four-year promises.
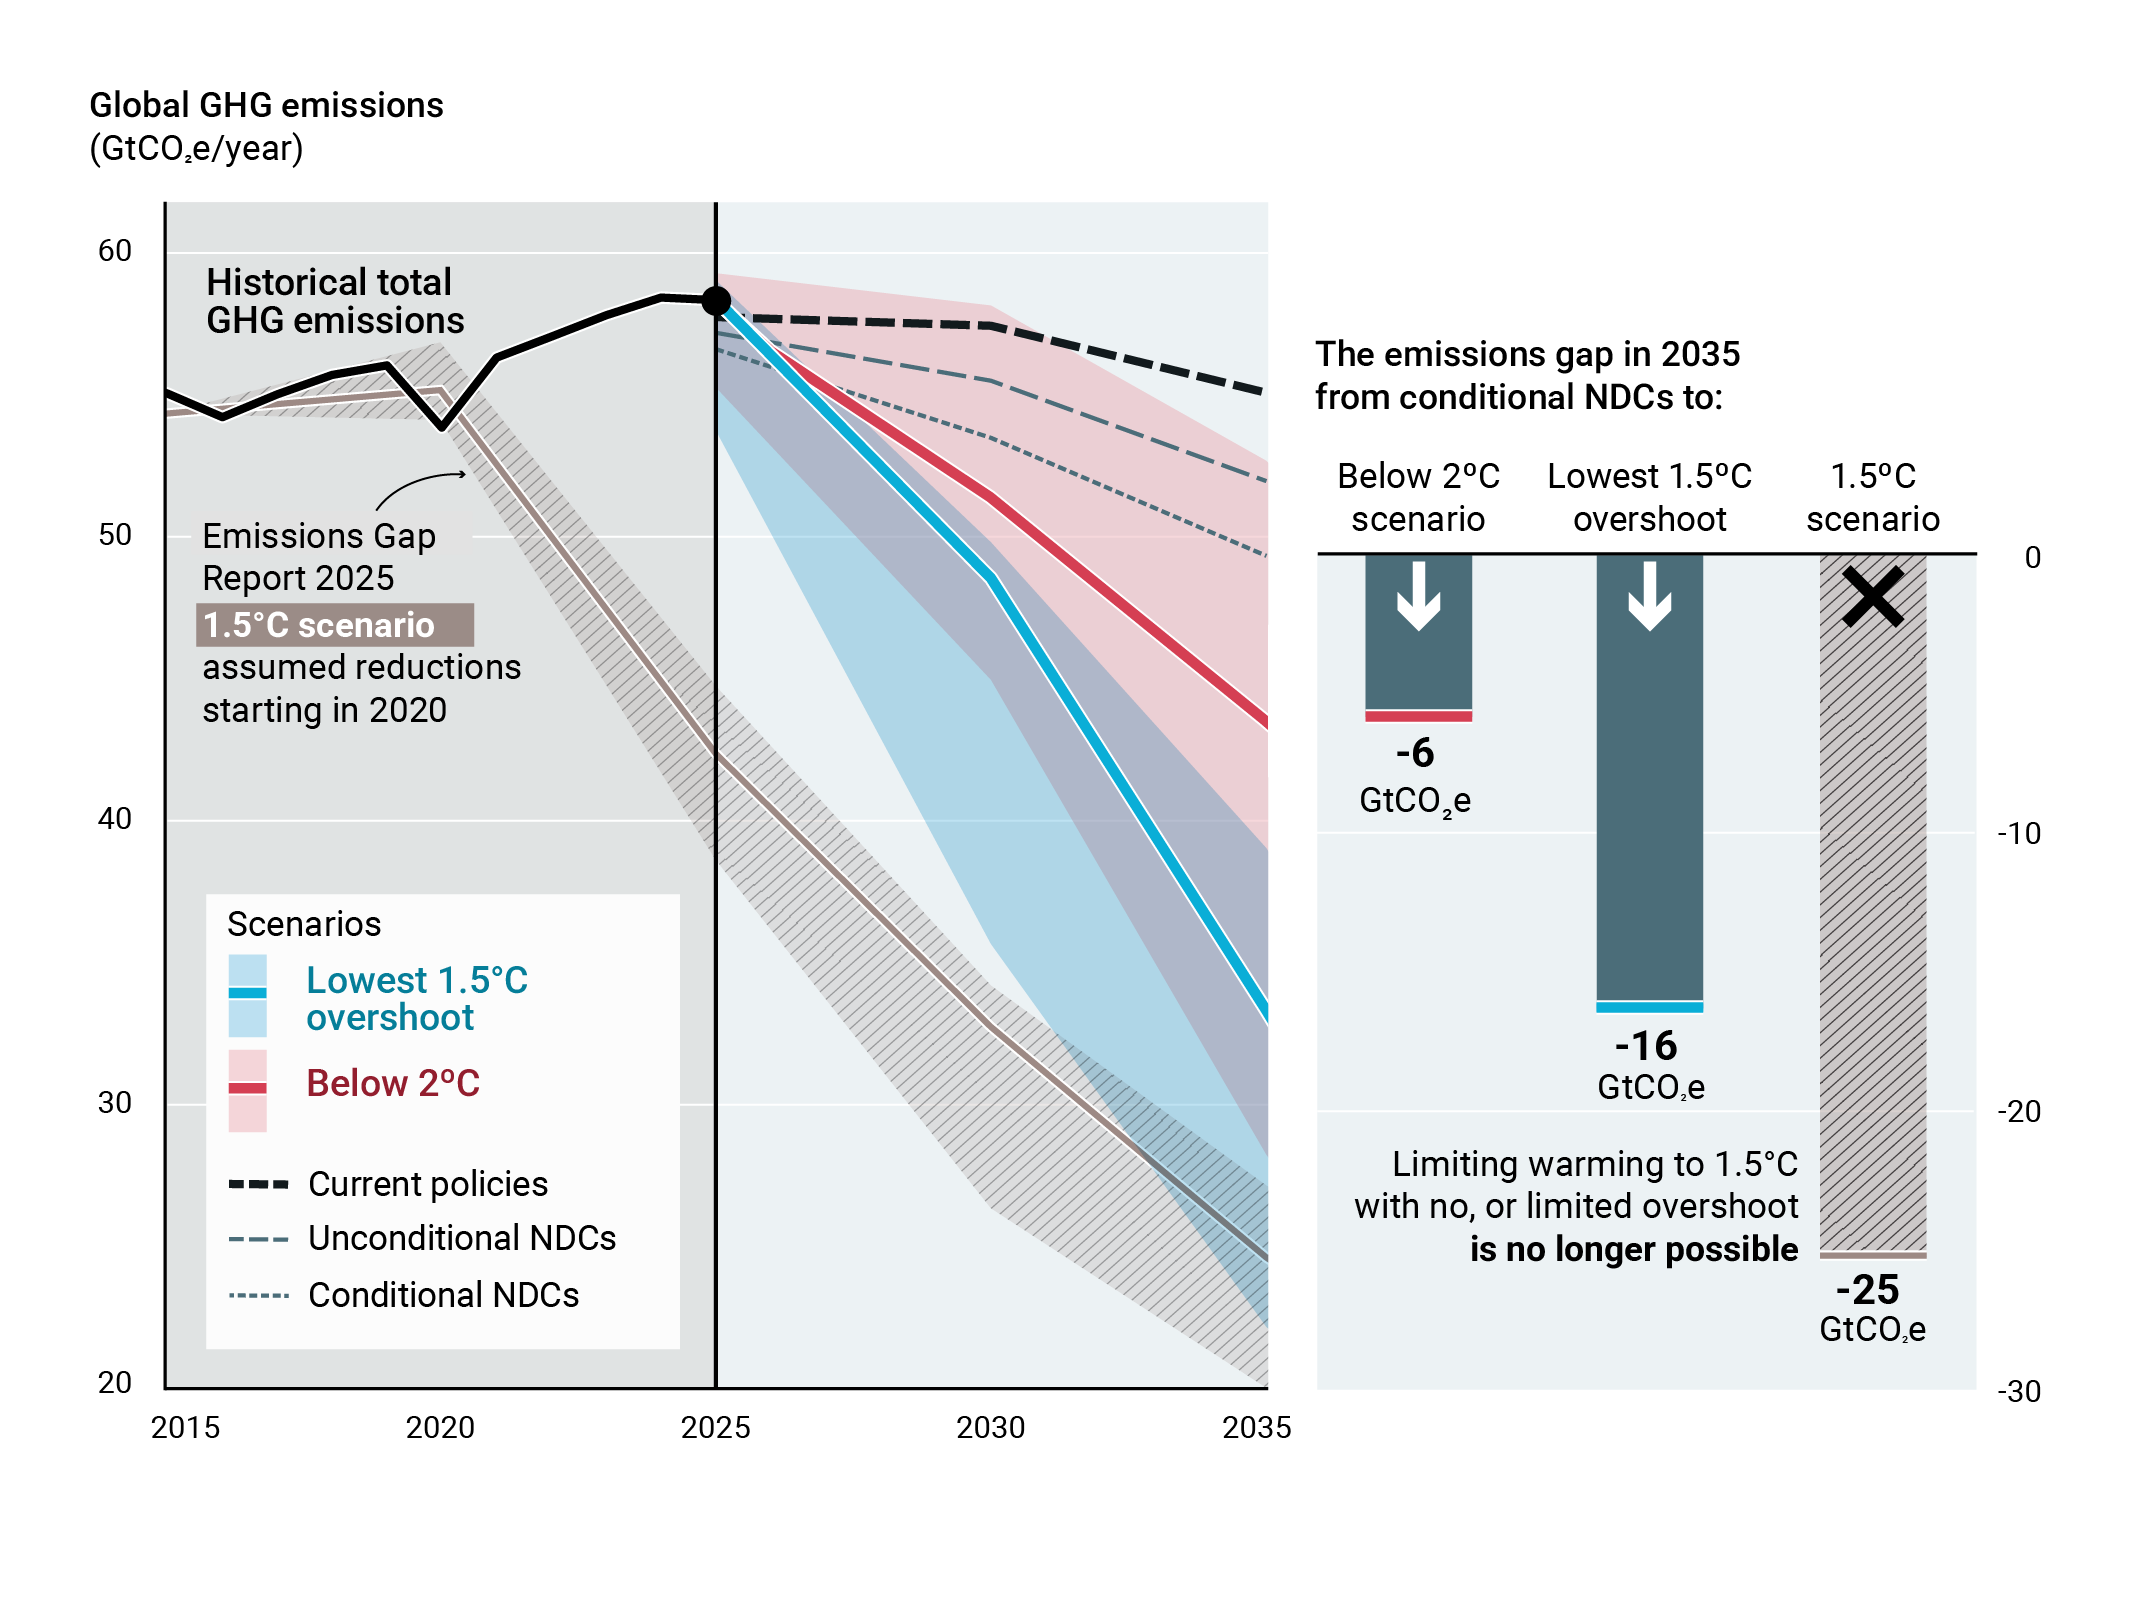 The left-hand chart shows projected emissions under the three NDC scenarios (median estimates), as well as the below 2C and lowest 1.5C overshoot scenarios (central estimates, plus the full min-max range) out to 2035. The right-hand chart shows the emissions gap in 2035 to the conditional NDCs. Credit: UNEP emissions gap report (2026)
 Credit: UNEP emissions gap report (2026)
Why the yardsticks themselves were replaced
Earlier editions measured pledges against pathways holding warming below 2C and 1.8C, or against 1.5C with a sliver of overshoot. Those three warming pathways came from the scenario database for the mitigation report of the Intergovernmental Panel on Climate Change’s (IPCC) sixth assessment, AR6 — scenarios built around 2015-20 that assumed the world would start cutting hard around 2020. It did not. Emissions today run around 80% above the level that would have been needed by 2030 to limit warming to 1.5C with no or low overshoot, so, on the authors' reading of decades of insufficient emission reductions, that option has now been lost and those pathways are outdated.
This edition instead draws on a new generation of pathways in which ambitious mitigation action starts from 2025: a below 2C route and the lowest 1.5C overshoot route. These updated scenarios reflect the failure to cut global emissions to date, and their design intent is explicit — the overshoot pathway minimise[s] both the magnitude and duration of overshoot above 1.5C while respecting feasibility and sustainability guardrails, such as not letting bioenergy and engineered carbon removals outcompete biodiversity and food security. Politically, that language tracks the Global Mutirão package agreed at the COP30 summit in Brazil in 2025, which for the first time in a COP text accepted that overshoot was likely and urged that both its extent and duration be limit[ed].
Practically, the old IPCC reference points — reductions of 43% by 2030 and 60% by 2035 from 2019 levels, quoted through a decade of COP decisions — are effectively retired, which matters because the seventh assessment's timetable remains uncertain and this report now supplies the working numbers.
Year-on-year arithmetic: what 2025 emissions actually did
Strip away the projections and the current picture is almost flat. Emissions in 2025 were comparable to 2024: total global greenhouse gases reached 58.4bn tonnes of CO2 equivalent (GtCO2e), roughly 0.16GtCO2e below the previous year, with high uncertainty attached. Because the numbers in this edition are provisional, the report states it is not possible to conclude on the overall direction of emissions in 2025.
The longer trend is one of deceleration rather than reversal: growth averaged 1.7% a year over 1990-2015 and about 0.8% a year since 2016. The chart below plots human-driven emissions from 1990 to 2025, split by gas.
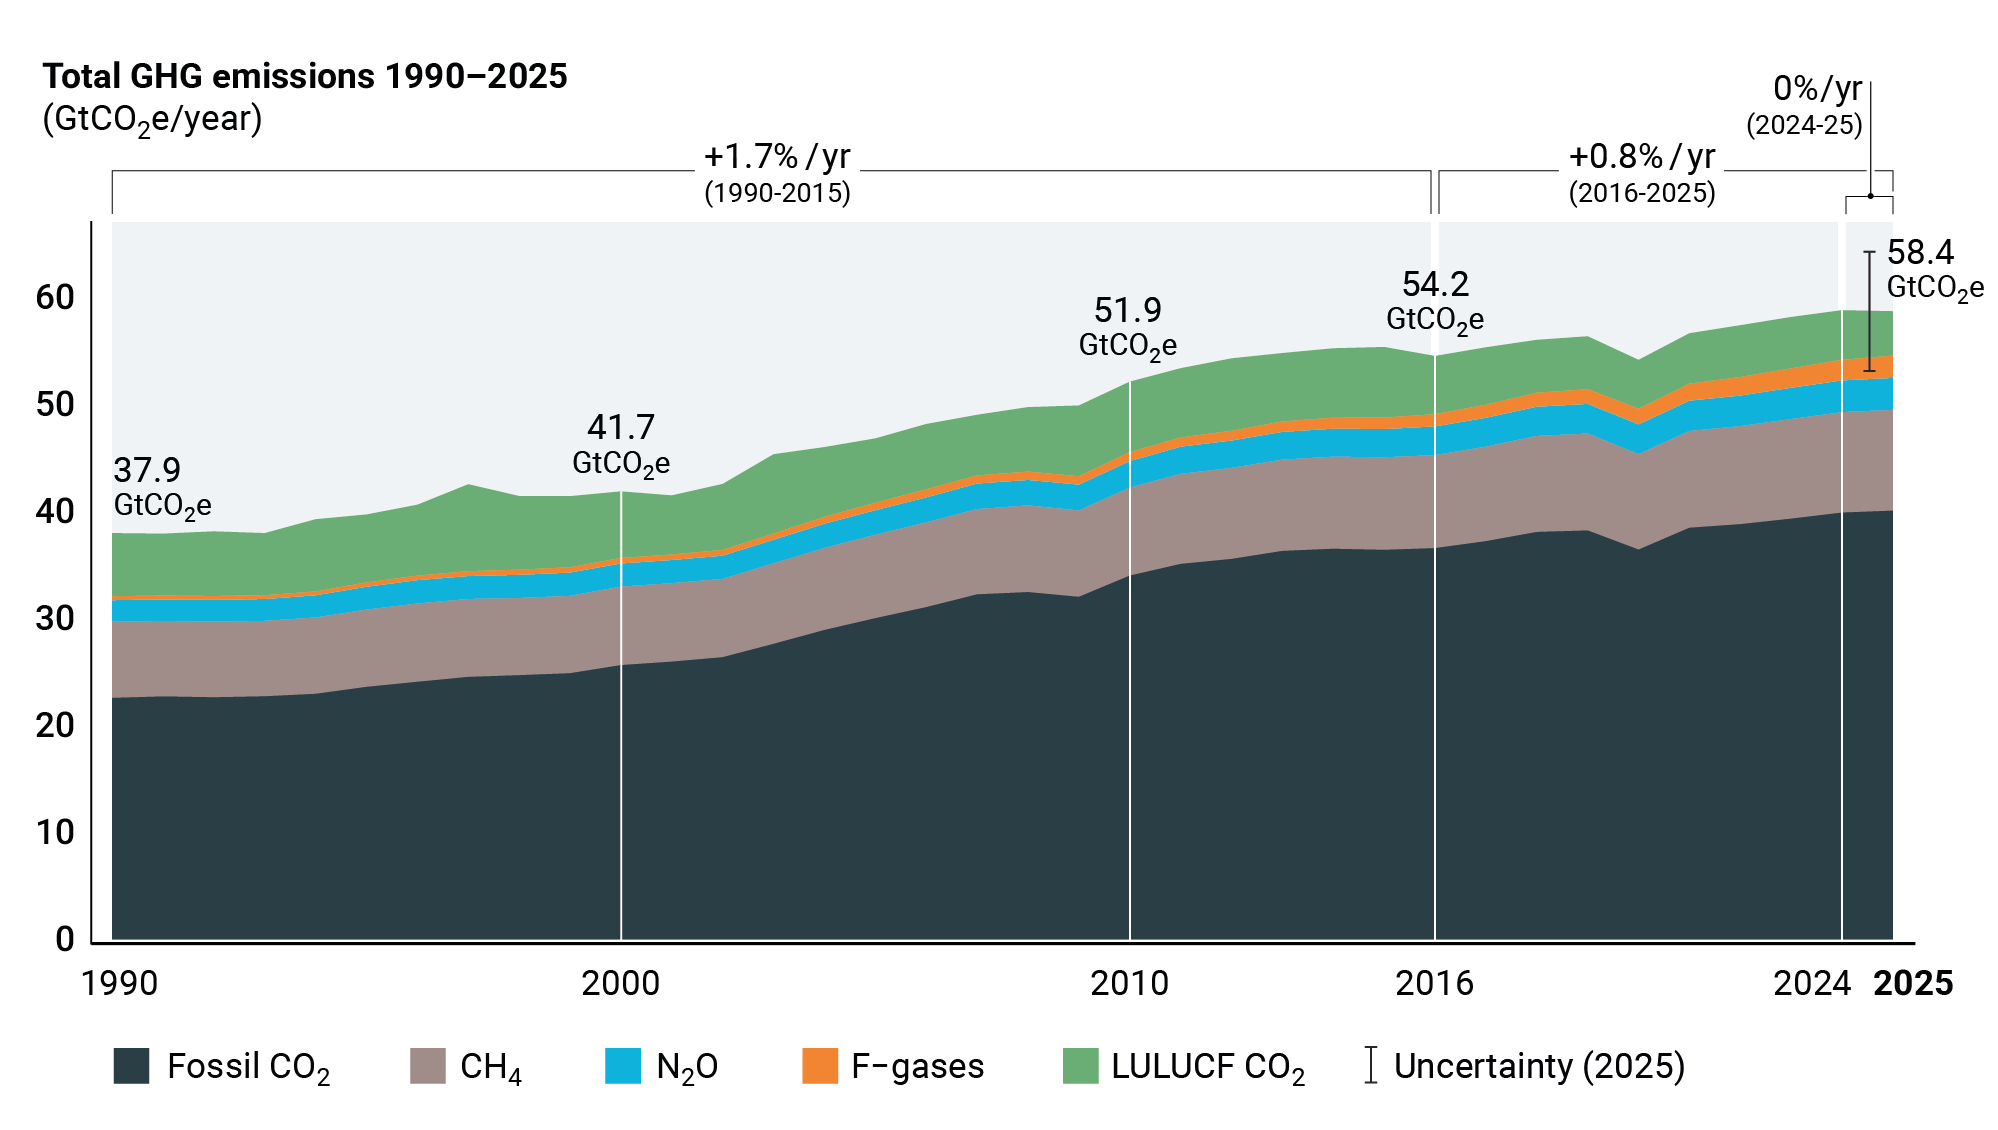 Credit: UNEP emissions gap report (2026)
Year on year, fossil-fuel emissions ticked up by 0.4-1.1%, and nitrous oxide and fluorinated gases rose faster — but because they form such a small slice of the total, their contribution to the overall trend is relatively less significant. Methane held steady. Falling emissions from land use, land-use change and forestry (LULUCF) slightly overcompensates for the fossil increase. That drop was partially driven by fewer wildfires, especially across Africa, South America and parts of south-east Asia, which the report notes were likely connected to the ceasing of El Niño conditions; the ongoing super El Niño is expected to push LULUCF emissions back up in 2026.
Nationally, the picture is uneven. Of the six largest emitters, only the US moved noticeably: its emissions rose by 133m tonnes of CO2e (MtCO2e) on higher electricity demand and a rebound in coal, helped along by a colder winter and costlier gas. China, the EU, India, Russia and Indonesia were broadly flat.
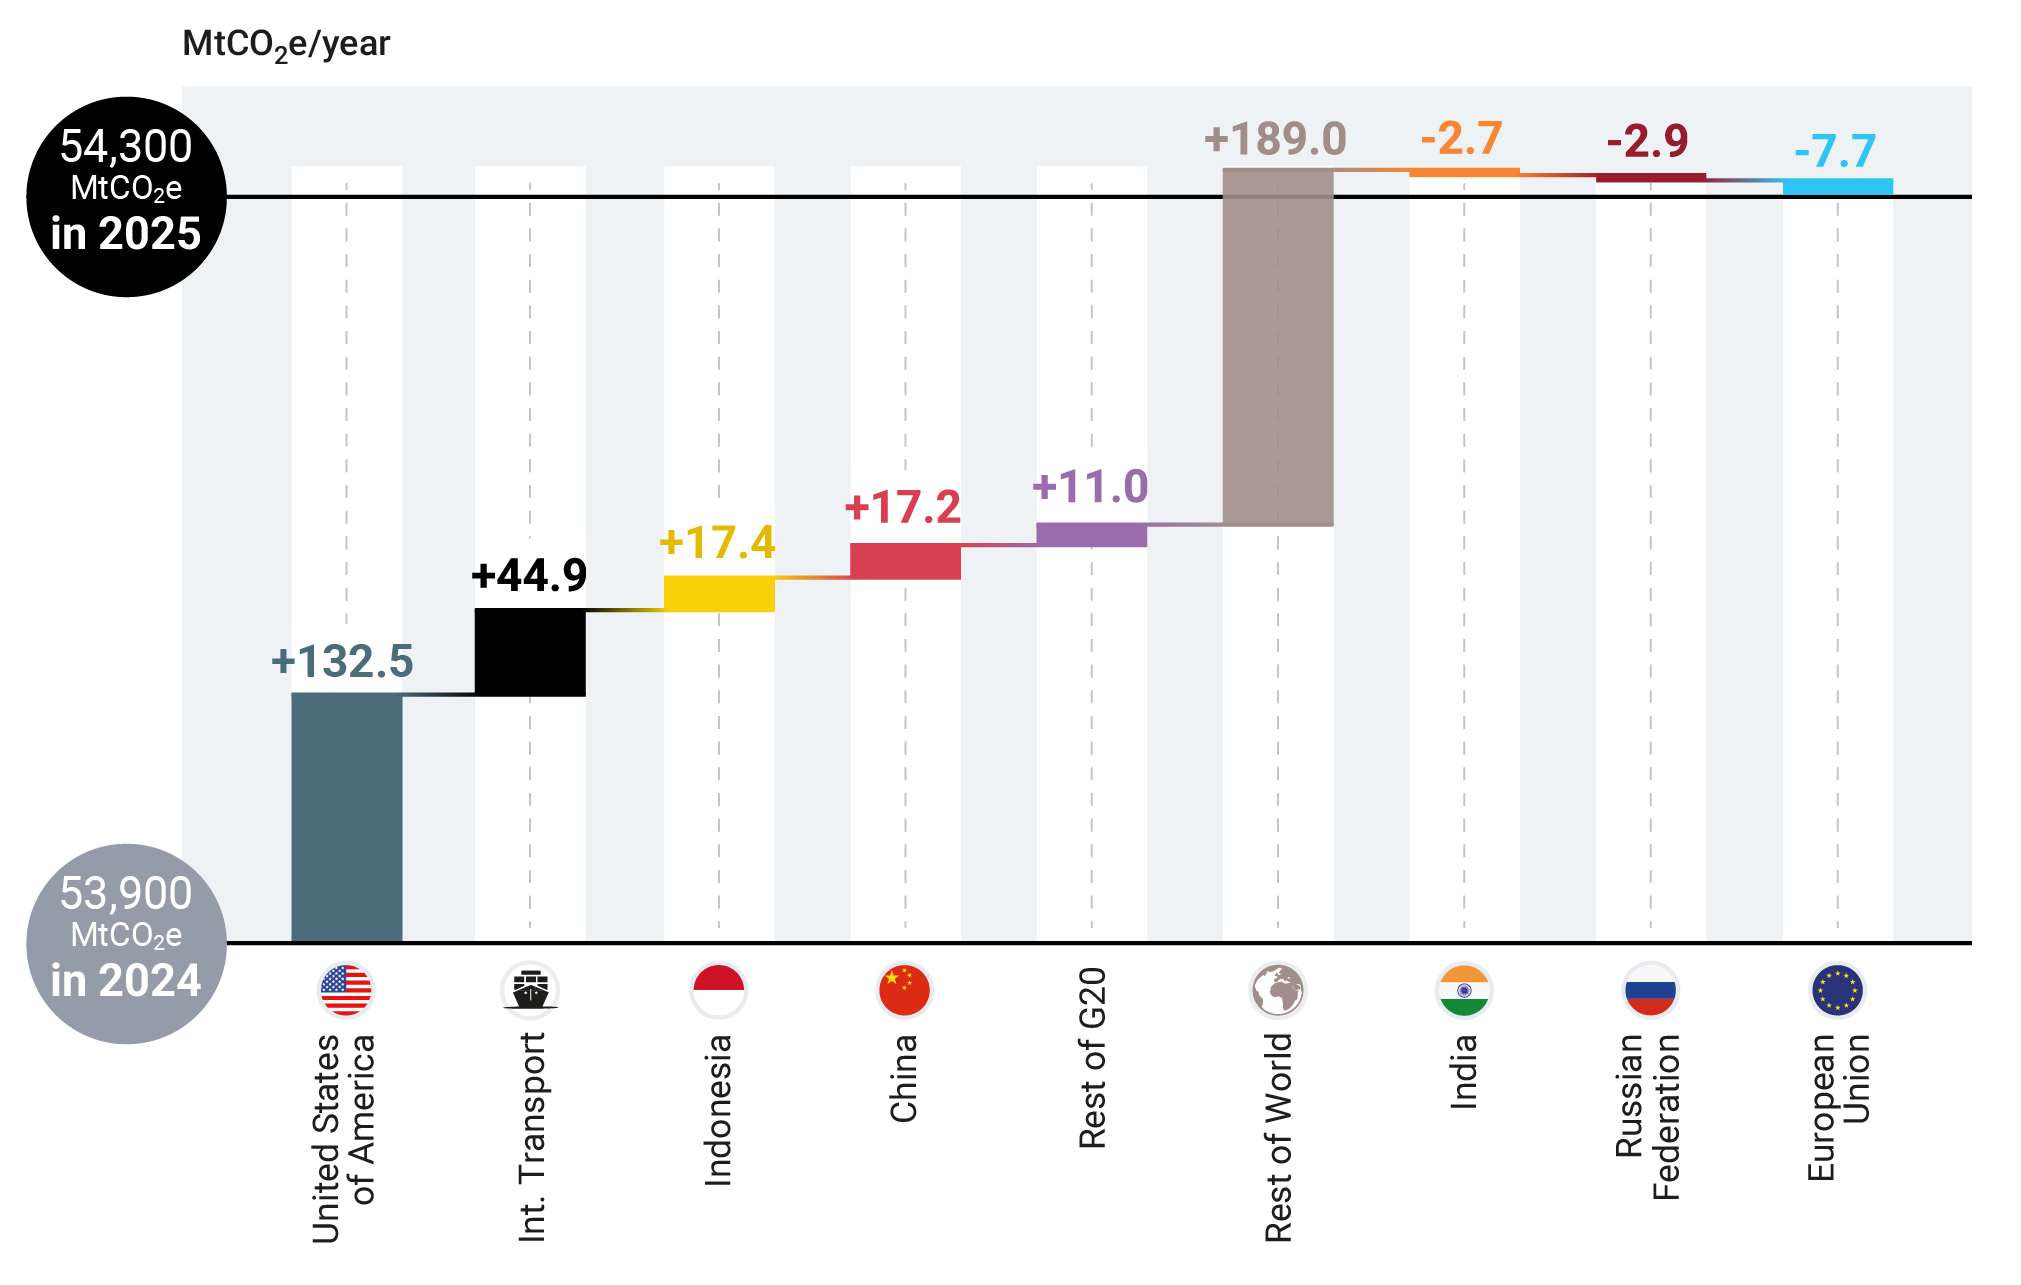 Credit: UNEP emissions gap report (2026)
Sector progress is modest at best, concentrated in power and transport thanks to solar and electric vehicles. The report's own wording: "There are emerging signs of transport sector electrification and decarbonisation, but at rates and levels that are not yet sufficient to drive emissions reductions at the global level." International aviation and shipping keep pulling transport emissions upward. And for readers tracking the technology sector: although electricity demand from data centres is projected to double by 2030, the report stresses that data centres account for less than 1% of total emissions today. That is consistent with the International Energy Agency's own modelling, which puts data-centre consumption at roughly 945 TWh by 2030 from about 460 TWh in 2024 — a fast-growing slice of a still-small pie (iea.org, Energy and AI).
Pledge scorecard: better documented, far from what is needed
On paper, country pledges have never been more complete. New 2035 nationally determined contributions were due by February 2025, and 95% of nations blew that deadline; a wave arrived at the September 2025 UN climate summit in New York and at COP30 in Brazil in November 2025. By the close of that summit 122 countries — 63% — had filed third-round NDCs, rising to 124 by 1 September 2026 and covering 75% of global emissions, giving assessors a more robust basis for assessing collective progress and ambition toward 2035.
Quality improved unevenly. The number of parties covering all greenhouse gases now stands at 155, after eight countries brought non-CO2 targets into scope for the first time, and submissions increasingly use more robust and verifiable target formulations. What has not changed is breadth: the pledges have not meaningfully broadened the scope of sectors and gases covered by the targets.
Run the numbers and the shortfall is stark. Full delivery of the third-round NDCs would put 2035 emissions 3.5GtCO2e below the 2030 trajectory — far from the global reductions needed to get on track to achieving the long-term temperature goal of the Paris Agreement. Projections for 2035 are about 3GtCO2e higher than in the 2025 edition, the result of the formal US withdrawal from the Paris Agreement and of harmonising the maths with newer historical data. The 2030 implementation gap narrowed, but chiefly because the US left the framework: policy changes, not policy progress. Gaps for 2030 and 2035 are similarly sized, which is why the report concludes that enhanced collective ambition of 2035 NDCs is weak.
Among the G20, 14 of the 17 members counting the EU as one have filed 2035 targets, yet most trajectories remain misaligned with their own net-zero promises — all members except Japan, the EU and UK would have to accelerate their emission reduction rates based on current policies to hit those long-term goals.
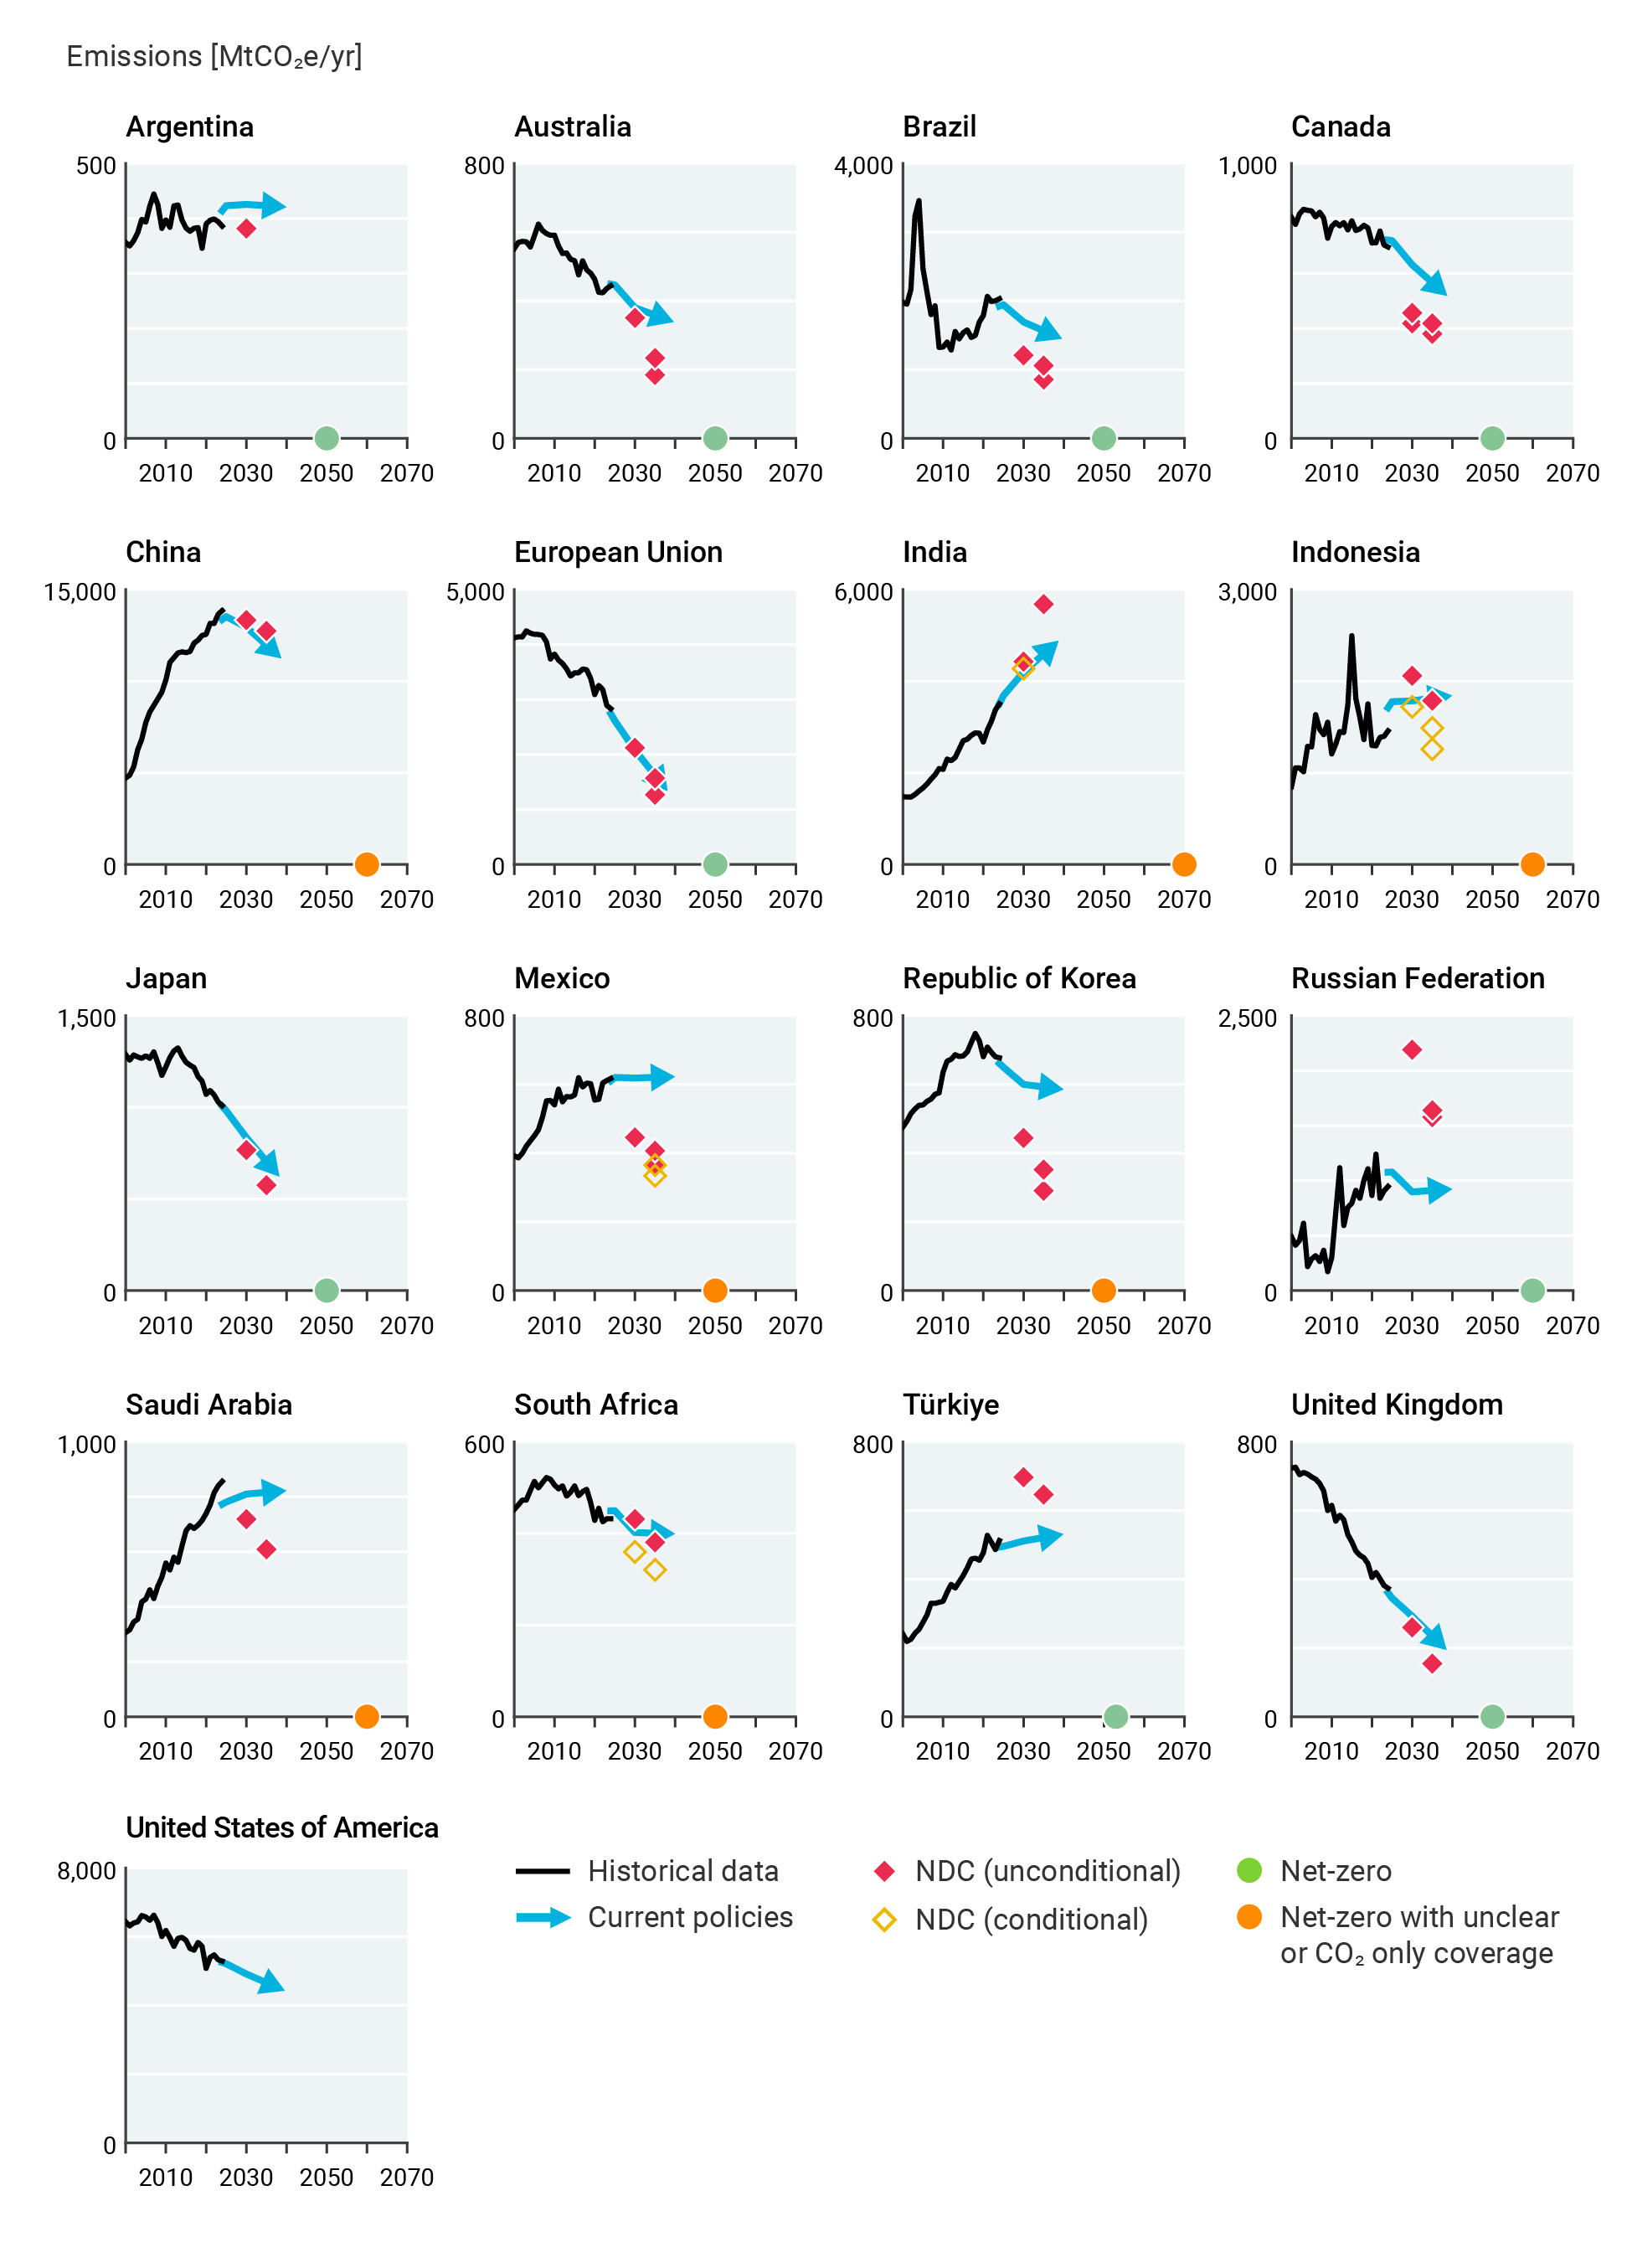 Credit: UNEP emissions gap report (2026)
Net: the emissions gap is still large, and current NDCs plus net-zero targets are not enough to minimise overshoot. Because both benchmark pathways were rebuilt, 2026 gaps cannot be compared directly with earlier reports.
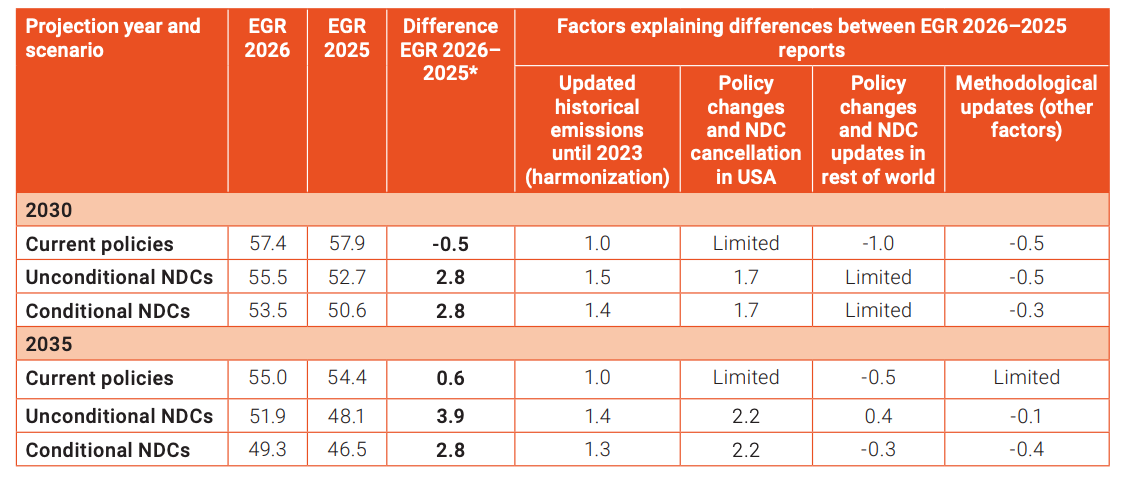 Credit: UNEP emissions gap report (2026)
Where reality beat the models — and where it did not
Benchmarked against the first global stocktake agreed at COP28 in Dubai in 2023, the report grades nine mitigation action areas. The overall verdict: "Uneven and insufficient." Yet it also records several remarkable examples of progress that exceeded expectations. Renewable deployment is the standout — total capacity came in three times higher than 2015-era projections assumed, and CO2 emissions from energy generation rose 40% less than forecast. On the report's ledger, only renewables are on track for 2030…though continued adoption and implementation of supportive policies will be required to sustain such growth, while several other areas are lagging particularly far behind.
Independent data supports that asymmetry. Ember's Global Electricity Review 2026 records renewables at 33.8% of world generation in 2025 — above a third for the first time — with solar meeting about three-quarters of global electricity demand growth (ember-energy.org). The gap between what power systems deliver and what heavy industry, aviation and agriculture deliver is exactly where the overshoot size gets decided.
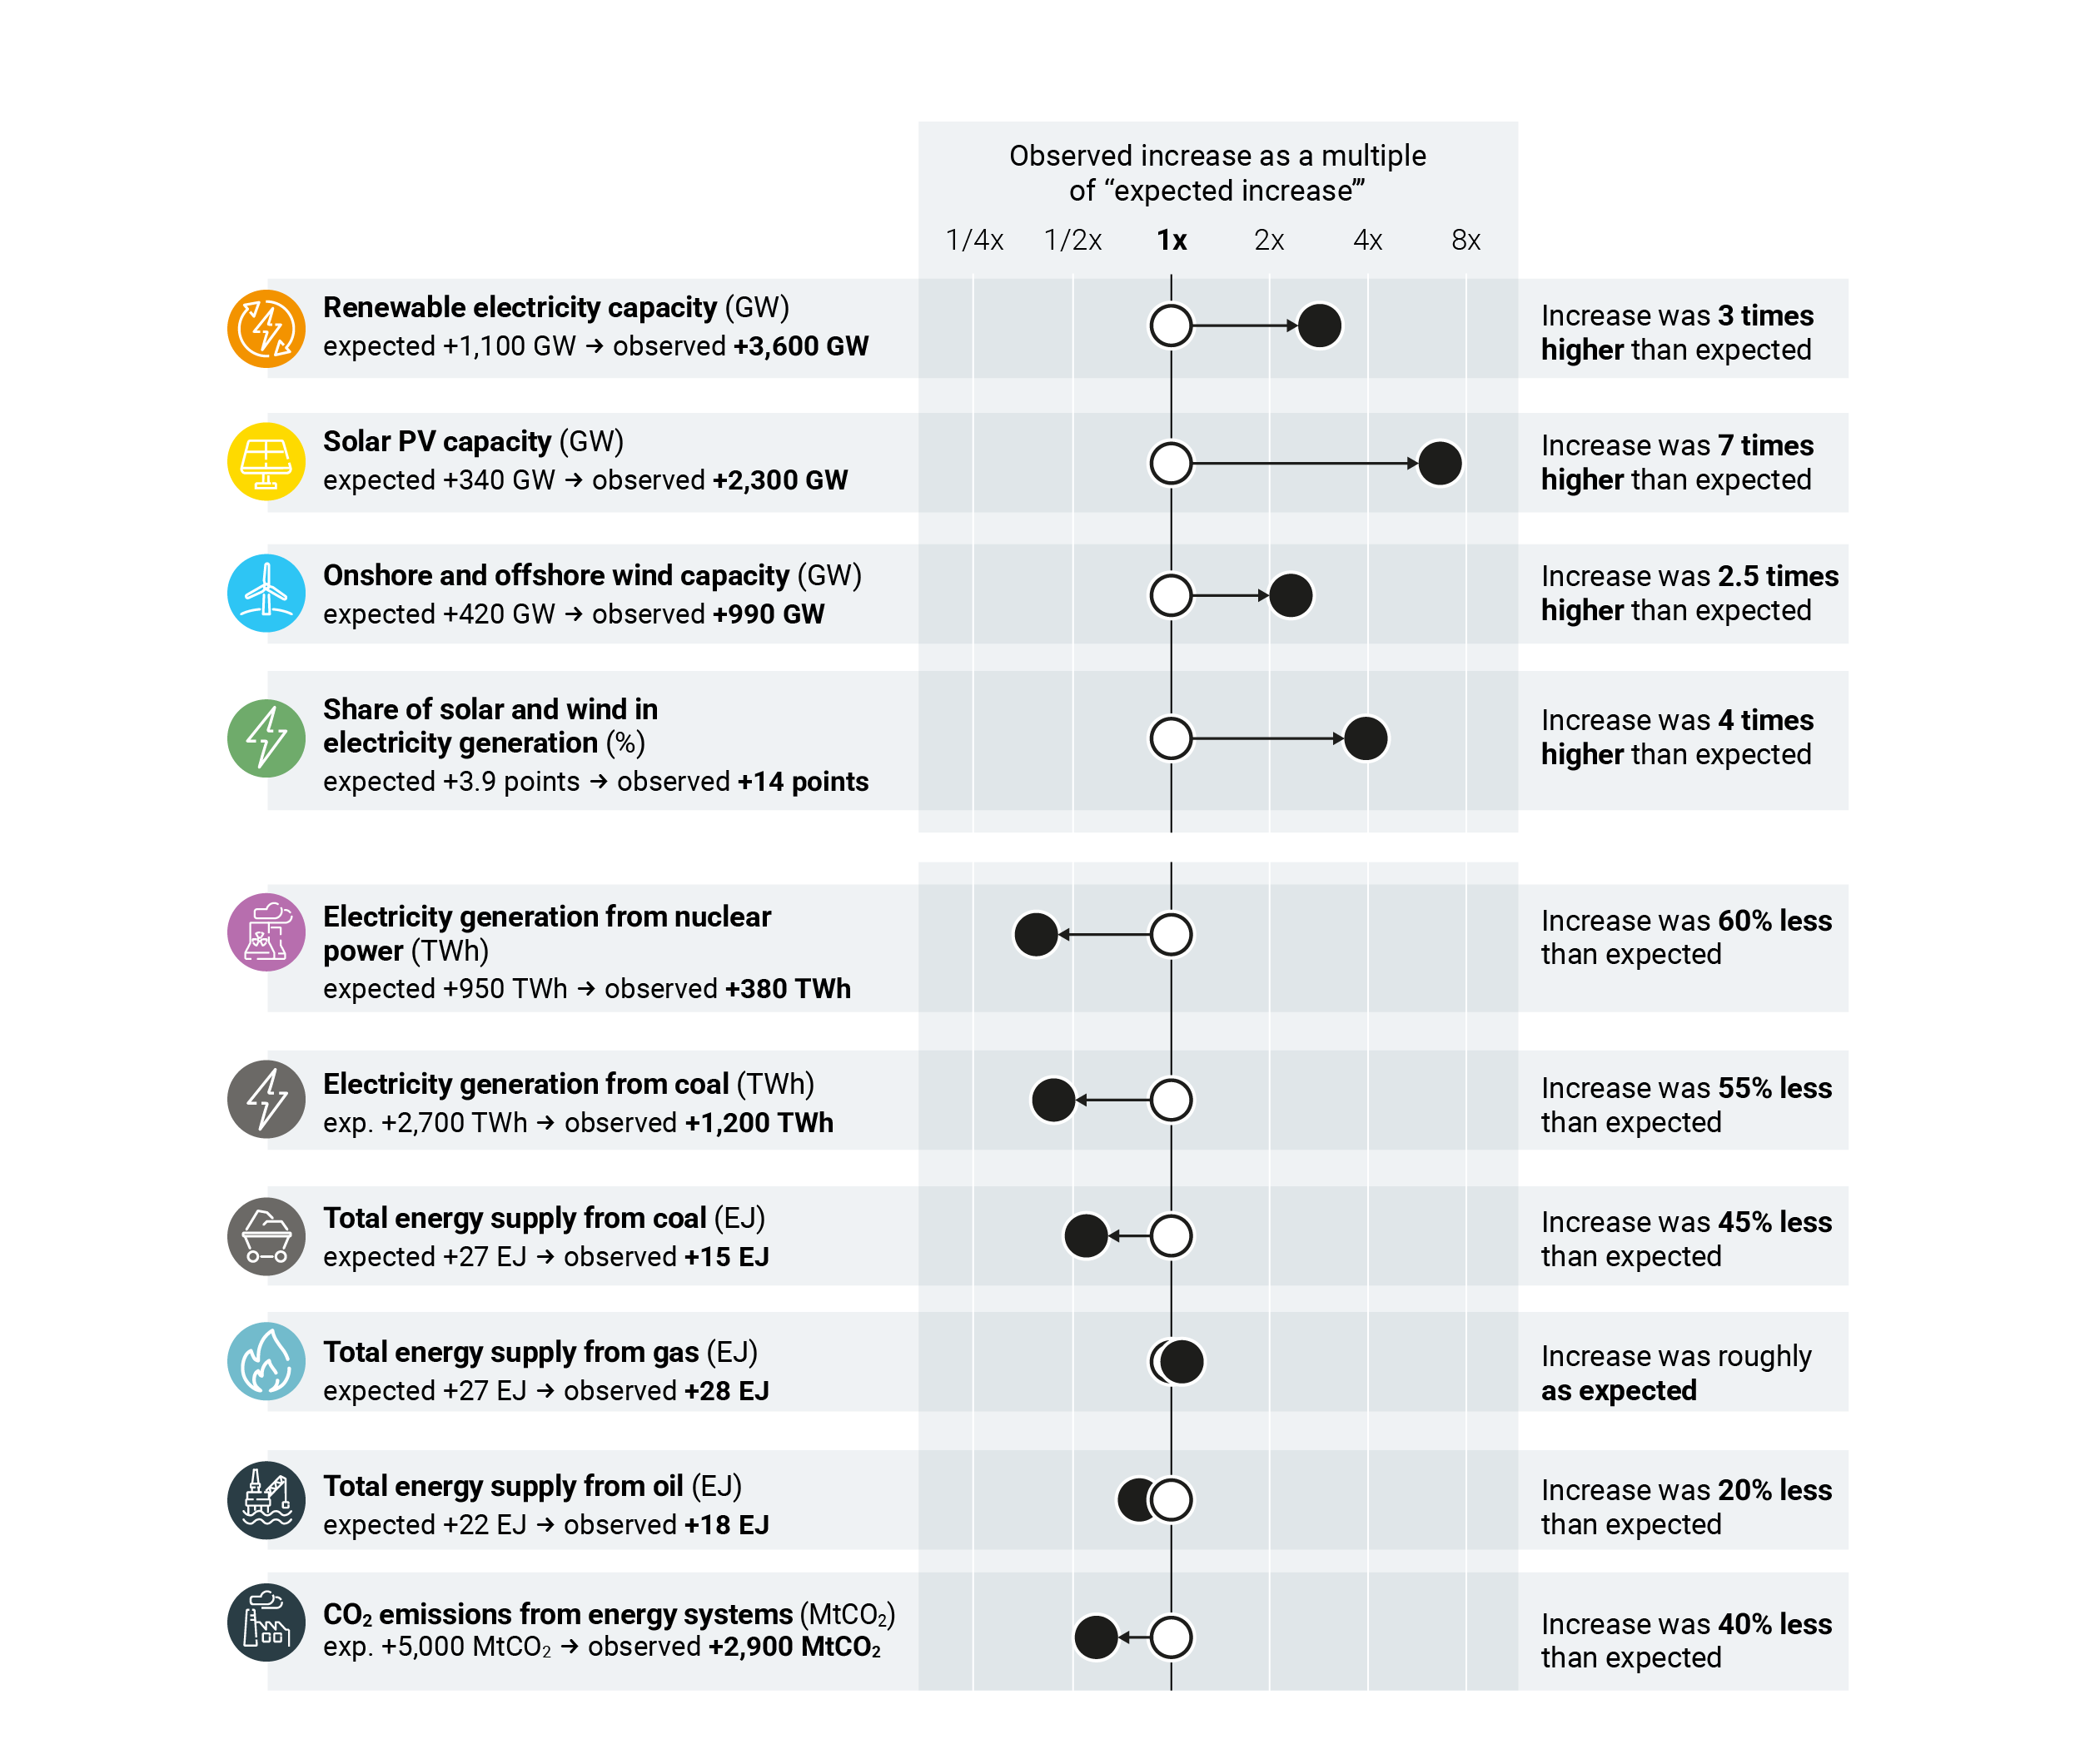 Source: UNEP emissions gap report (2026)
Four misreadings worth avoiding
- "Overshoot means Paris failed." Overshoot means the goal changed shape, not vanished: with immediate, deep, rapid and sustained emission cuts, peaking at 1.7-1.8C is still on the table, and a return to 1.5C is still definable.
- "The narrowing gap proves countries are delivering." It mostly records the US departure from the Paris Agreement — policy changes, not policy progress.
- "18% by 2030 sounds easier than the old 43%." The baselines differ: the new figures are measured from 2025, the AR6 figures from 2019, and the required annual rate — 5.7% — is steeper than the 5% that pre-2019 action implied.
- "Data centres are the climate problem now." Their power demand is projected to double by 2030, but their share of total emissions remains below 1%.
The price of waiting, in three currencies
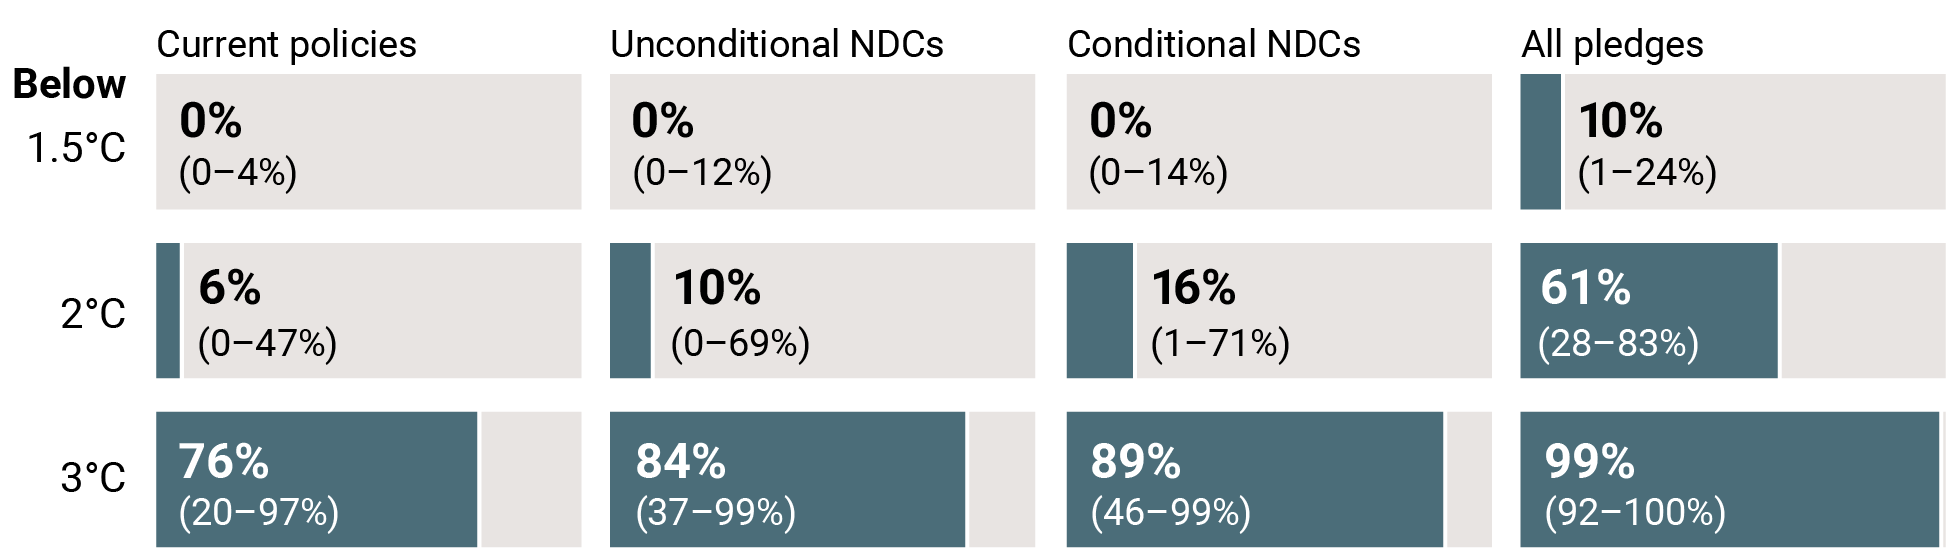
Temperature: "For every five years of delay in starting to cut emissions, around another 0.1C of warming will be locked in." Continued insufficient emission reductions over the next decades could make warming of 2C inevitable, putting the Paris Agreement at risk of failure — and continued delay only further worsen the climate outcomes still achievable.
 Credit: UNEP emissions gap report (2026)
Money: overshoot shifts cost from mitigation to adaptation. UNEP's Adaptation Gap Report 2025 puts developing countries' annual adaptation finance needs at about US$310bn in 2035 on modelled costs, and as high as US$365bn under a wider range — roughly twelve to fourteen times current public flows (unep.org).
Engineering: the return trip depends on removals. Syntheses compiled by Carbon Brief indicate global carbon dioxide removal would need to rise from roughly 2.2GtCO2 today to about 8.75GtCO2 a year by 2050 to pull temperatures back — a scaling challenge with no precedent in industrial history (carbonbrief.org).
For context on the reporting lineage, Carbon Brief has detailed coverage of previous editions of this assessment published in 2014, 2015, 2016, 2017, 2018, 2019, 2020, 2021, 2022, 2023, 2024 and 2025.
Decision checklist: who should do what next
- Technology and data-centre operators: treat the 1% emissions share as a licence to grow, not a licence to ignore procurement — lock in power purchase agreements while solar expansion is the one trend running ahead of projections.
- Investors and corporate strategists: use the 18% / 45% / 69% milestones as the timeline test, not the 2.8C headline; portfolios aligned to current policy are priced for the tier nobody chose.
- Public-sector and city planners: plan for a band of outcomes — the low-probability tail matters, given the 10% chance of exceeding 3.4C under today's policies.
- General readers: judge every future climate headline against three questions — how high does it peak, how long does it stay above 1.5C, and what removes the carbon on the way back down.
FAQ
Is 1.5C now formally abandoned?
No. The overshoot pathway is still described as still aligned with the long-term temperature goal of the Paris Agreement, because the goal is defined over the century rather than at a single moment — the report's job is to establish a credible return path to 1.5C by the end of the century.
Which single number best summarises the shortfall?
Compare 18% by 2030 and 45% by 2035 — what the best pathway needs — with 5-8% and 11-15 % — what existing pledges deliver relative to 2025 levels.
Why did projections get worse if emissions barely grew?
Two accounting reasons rather than new pollution: the US withdrawal from the Paris Agreement and harmonising historical emissions upward, which lifted 2035 projections by about 3GtCO2e and warming estimates by 0.2-0.3C.
Does overshoot make carbon removal pointless?
The opposite. Returning from 1.7-1.8C to 1.5C requires removals combined with an ambitious and sustainable scale-up of CO2 removal, and the report's most encouraging finding — renewables running three times higher than projected — shows how quickly technology curves can beat forecasts.
What would change the verdict?
Closing the distance between promises and practice: the assessment highlights the need both to close the implementation gap between current policies and existing NDCs and net-zero pledges, and to strengthen NDCs or exceed existing commitments.
The takeaway for ItInsightsWorld readers
The honest reading of The point of return is that the world has traded a single narrow goal for a set of comparable options — and that the choice between them is now made by governments, investors, utilities and technology buyers every quarter, not once at a summit. Nothing in the report says the return trip is impossible; it says the ticket is getting more expensive and the departure board is running late. Compare pathways, price the delay, and act on the tier you can actually influence.
Written by James Hartley for IT Insights. For corrections, data questions or to share a scenario we should compare next, contact contact@itinsights.com.