
Seres October 2026 Sales Slide: Reading a 41.66% Q3 Revenue Drop for EV Trends
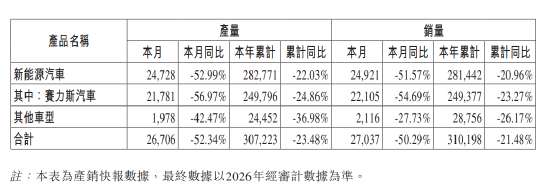
A sharp change in monthly sales can feel like a minor data point until it connects with profit margins, supply chain costs and product cycles. For readers trying to understand the electric vehicle (EV) market, the numbers behind Seres offer a practical case study. In October 2026, Seres sold 27,037 vehicles, down 50.29% from a year earlier. Over the January-October 2026 period, cumulative sales reached 310,198 units, down 21.48%. In the new energy vehicle segment, October sales were 24,921 units, down 51.57%, with Jan-Oct 2026 cumulative sales of 281,442 units, down 20.96%. Within that segment, Seres Auto recorded 22,105 units in October, down 54.69%, and 249,377 units for the year to date, down 23.27%.
At first glance, the headline is simple: sales are falling. The more useful question is what those figures reveal about the wider market. A decline can come from one weak month, a model transition, pricing pressure, channel changes or a shift in consumer confidence. When it appears alongside a company earnings report, the story usually becomes more three-dimensional.
What the October 2026 sales figures show
Monthly production and sales reports are useful because they provide an early signal before full financial statements arrive. The October 2026 data show that the decline is not limited to a single narrow category. The total vehicle count fell by half compared with October 2025, while the new energy vehicle line showed a similar pattern. Seres Auto, the more visible brand within the structure, also weakened more sharply than the total new energy vehicle count.
For a general reader, the most important interpretation is not “one number is bad,” but that the pressure appears across several layers: overall deliveries, new energy vehicle deliveries and the brand-level sales line. That makes the report less likely to be only a timing issue and more likely to reflect a real demand-side or market-share shift.
Q3 and nine-month financial picture
Alongside the October data, Seres disclosed its 2026 Q3 and nine-month financial results. In the third quarter of 2026, revenue was RMB 28.08 billion, down 41.66% year over year. Net profit attributable to shareholders of the parent was RMB 1.42 billion, down 40.12%, although profit returned to positive compared with the previous quarter. Net loss after deducting non-recurring items was RMB 1.365 billion, a 159.54% decline on the same measure.
For the first three quarters of 2026, cumulative revenue was RMB 85.573 billion, down 22.58%. Net loss attributable to shareholders of the parent was RMB 297 million, while net loss after deducting non-recurring items reached RMB 3.744 billion.
Why the numbers moved
The company explained the revenue decline mainly through lower new energy vehicle sales. For profit decline, the report listed three major reasons. First, external conditions and industry cycles raised pressure on core components for new energy vehicles, increasing the cost of building vehicles for a period. Second, Seres raised both the scale and intensity of research and development spending, with nine-month R&D expenses reaching RMB 5.689 billion. Third, a former subsidiary no longer entered the consolidated scope, and the accounting method changed from the cost method to the equity method, increasing non-recurring gains and losses.
This combination matters because it separates short-term selling pressure from longer-term business investment. A sales drop can hurt revenue quickly. Higher component costs can squeeze margins before prices adjust. Stronger spending on research can reduce current profit while building future competitiveness. Accounting changes can make headline profit look different from operating profit, which is why the “after non-recurring items” figure is so important in this report.
A simple comparison table
| Indicator | October 2026 | Jan-Oct 2026 | Q3 2026 |
|---|---|---|---|
| Total vehicles sold | 27,037 units, down 50.29% | 310,198 units, down 21.48% | — |
| New energy vehicles sold | 24,921 units, down 51.57% | 281,442 units, down 20.96% | — |
| Seres Auto sold | 22,105 units, down 54.69% | 249,377 units, down 23.27% | — |
| Revenue | — | — | RMB 28.08 billion, down 41.66% |
| Profit after non-recurring items | — | — | RMB 1.365 billion loss, down 159.54% |
Why a general reader should care
The story is not only about one automaker. It touches decisions that ordinary consumers, investors and small business owners make every day. If EV makers face component cost pressure, the market may see more incentives, slower price reductions or changes in product availability. If a company spends more on research while revenue falls, readers may notice delayed model updates, stronger software integration, or more aggressive competition in future quarters.
For buyers, the practical question is how to judge whether a sales decline reflects a temporary adjustment or a deeper change in competitiveness. For investors, the question is whether future spending today creates value later. For anyone tracking the transition to cleaner transport, the key lesson is that adoption curves rarely move in straight lines. Policy support, infrastructure, consumer confidence, pricing and product quality all interact.
Common misconceptions
- Myth: one bad month proves the company is failing.
Reality: October sales matter, but a full judgment needs quarterly earnings, model lifecycle, channel inventory and longer demand trends. - Myth: profit is the only reliable measure.
Reality: when non-recurring gains and losses are large, earnings quality is better understood through profit after non-recurring items. - Myth: higher research spending is always negative.
Reality: R&D can reduce short-term profit while funding safer, smarter or more efficient products. - Myth: lower sales always mean lower quality.
Reality: demand can be affected by price, competition, product refresh timing, dealer networks and consumer expectations. - Myth: a single percentage tells the whole story.
Reality: percentage changes are easier to misread when the prior-year base is high or when product mix changes.
Actionable ways to interpret this type of news
- Separate volume, price and cost. Revenue depends on how many units are sold and at what average price. Margin depends on material costs, component costs, manufacturing efficiency and incentives.
- Check the time window. Monthly figures reveal momentum, while nine-month results reveal whether pressure is persistent.
- Read recurring versus non-recurring items. If accounting changes affect non-recurring gains, operating health may require looking beyond headline profit.
- Look at category mix. A decline in new energy vehicles may be more informative than a decline in total vehicles because it affects core future growth.
- Watch spending on research. Higher R&D is not automatically bad, but it matters whether the spending matches revenue, product needs and market position.
FAQ: What readers often ask
What caused the October 2026 sales drop?
The report shows the drop in units and links the revenue decline mainly to lower new energy vehicle sales. The company also cites industry cycle effects, component price pressure, stronger research spending and accounting changes as reasons for weaker profit performance.
Is Seres still profitable?
Based on the disclosed 2026 Q3 report, net profit attributable to shareholders of the parent was RMB 1.42 billion, down 40.12% from a year earlier and positive compared with the previous quarter. However, net loss after deducting non-recurring items was RMB 1.365 billion, so the quality of profit requires a closer look.
Why do the nine-month numbers differ from the October numbers?
October reflects one month of demand and deliveries. Nine-month cumulative results smooth the trend and reveal whether short-term weakness is isolated or part of a longer pattern.
What should buyers watch before choosing an EV?
Buyers should not focus only on sticker price. Useful checks include total cost of ownership, charging access, resale value expectations, software updates, warranty conditions, parts availability and how often the brand refreshes models.
Does a sales decline prove weak demand?
Not necessarily. A decline may reflect weak demand, product transition, competitive pressure or changes in dealer channels. The safer conclusion comes from combining sales, earnings, inventory and market-share data.
The bigger takeaway
The Seres report is a reminder that market information becomes useful when it is placed into context. A sharp October decline is meaningful, but its real significance comes from how it aligns with revenue, profit, R&D and cost changes. For readers, the best response is not a single dramatic conclusion. It is a simple framework: track demand, understand costs, compare recurring performance, and judge whether current spending supports future competitiveness. In the fast-moving EV sector, that kind of reasoning turns a sales report from a headline into a decision-making tool.