
Beyond the 55.5% Headline: Why October's U.S. Factory Boom Could Land on Your Next Receipt
Most households never step onto a factory floor, yet the pace of work there sets the price and the delivery date of nearly everything a household buys. Read from IT Insights' vantage point, the latest industrial snapshot carries one honest conclusion: American plants are running at their strongest cadence in about five years, demand is outrunning what suppliers can physically ship, and the cost of that mismatch is being passed forward — first to wholesalers, then to retailers, and finally to whoever is standing at the checkout counter. Below, we unpack what the report says, what is driving it, why a second widely followed survey told a different story about prices, and what a non-specialist should actually do with all of it.
The verdict, stated up front
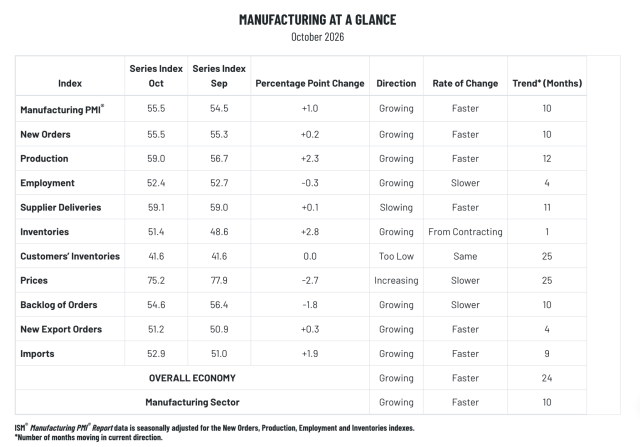
The Institute for Supply Management published its monthly manufacturing survey on Nov. 2, and the top line is not ambiguous. The ISM PMI registered 55.5% in October, up 1.0 percentage point from September's 54.5%. Because any reading above 50 denotes growth, the survey recorded the 10th consecutive month of factory expansion and confirmed 10 straight months of industrial growth following an earlier 10-month contraction. ISM also reads the same result as evidence that the overall U.S. economy grew for a 24th consecutive month, and according to ISM economic modeling the October figure corresponds to a 2.7% annualized increase in real gross domestic product (GDP).
Susan Spence, chair of the ISM Manufacturing Business Survey Committee, described the month in one sentence: “In October, U.S. manufacturing activity remained in expansion territory. Of the five subindexes that make up the PMI, four (New Orders, Production, Supplier Deliveries, and Inventories) grew faster than the previous month, while employment growth slowed down by 0.3 percentage points.”
 Susan Spence (Source: ISM)
A detail that rarely reaches the headline: the print was not merely positive, it was a surprise. Analyst forecasts circulated before publication clustered near 54.7%, per market summaries of the release carried by wallstreetcn.com — the upside was therefore both level and expectation. Breadth, however, is less flattering. The full report shows 12 of 18 manufacturing industries expanding in October and three contracting — printing, paper and non-metallic mineral products — the same count of growing industries as September and fewer than the 15 recorded in August and July. A strong average on a narrowing base is the tension running through every number that follows.
What accelerated: output, orders, and a bottleneck nobody expected to return
The Production Index climbed 2.3 percentage points to 59.0% in October from 56.7% in September. That 59.0% reading is the subindex's highest level since November 2021 (60.5%) and marks its 12th consecutive month of expansion.
 (Source: Institute for Supply Management)
Buyers kept pace. The New Orders Index reached 55.5%, up 0.2 percentage points from September's 55.3%, extending growth for a 10th consecutive month, while the Backlog of Orders Index fell to 54.6%, down 1.8 percentage points from September's 56.4%, yet stayed in expansion for a 10th straight month. Translated for a general audience: customers are still writing more orders than plants can finish, and the unfinished pile is shrinking only because factories are working harder.
Panelists in high-tech and defense markets paired that picture with severe scheduling strain. A machinery-sector executive wrote: “Explosive growth in the semiconductor and government/defense spaces has put us on our heels as we try to work through demand. The long-awaited wave has arrived for our company, and it seems the global supply chain is in similar straits. Lead times and prices are rising, and some carry Covid-19 era delays—four weeks is now 50 weeks; a $2,000 item six months ago is now $4,000. We are hand-to-mouth. All the while, our customers are breaking down the doors complaining about our delivery delays.”
The pressure is concentrated rather than universal. A miscellaneous manufacturing respondent pointed straight at the AI build-out: “New month, same trends: Any commodity consumed by AI/data centers is in a crunch, both for supply and pricing.” Outside that trade, big-ticket demand turned cautious. A computer and electronic products executive observed that “global demand for capital scientific instrumentation assets has slowed due to continued uncertainty in the Middle East, Eastern Europe, and China.” The same executive added that “anticipation over the mid-term elections and impact to funding for scientific research and the National Institutes of Health also is impacting customers’ purchasing behavior, making them focus on optimizing existing technology and tools.”
Labor and stockpiles: the two gauges lagging the rebound
Hiring continued, at a slightly moderated pace. The ISM Employment Index registered 52.4%, down 0.3 percentage points from September's 52.7%, making October the fourth month of payroll gains — a fourth consecutive month that summaries of the report describe as the longest unbroken run of factory hiring since early 2022. Respondents favored hiring over headcount management by a 1.8-to-1 ratio. Eight manufacturing industries reported expanding employment, including four of the big six sectors — Machinery, Transportation Equipment, Computer & Electronic Products, and Food, Beverage & Tobacco Products.
Stockpiling reversed more abruptly. The Inventories Index jumped 2.8 percentage points to 51.4%, up from 48.6% in September, pulling raw-material buffers back into growth after one month of contraction. Seven industries expanded inventories, led by printing, plastics, textiles, and three of the big six sectors (Food, Beverage & Tobacco Products, Transportation Equipment, and Machinery).
Restocking is a tell, not a footnote: firms normally rebuild shelves when they expect to pay more later. A chemical products executive supplied the arithmetic, reporting that costs are up more than 6% and that “of the tracked items, only nine are lower, 24 are higher, and six are neutral.”
Prices: a softer print sitting on a high floor
The Prices Index registered 75.2%, down 2.7 percentage points from September's 77.9%. Even after that easing the gauge indicates that raw material prices increased for the 25th consecutive month, with 53.1% of respondents reporting higher prices compared to 58.6% in September, while Five of the six largest manufacturing sectors reported paying more for inputs.
Spence traced the persistence to three drivers: “The Prices Index reading is still being driven by (1) increases in steel and aluminum prices that impact the entire value chain, (2) tariffs applied to many imported goods, and (3) increases in petroleum-based products as a result of the Middle East conflict.”
Delivery speed is the tiebreaker between a cost blip and a cost regime. The Supplier Deliveries Index registered 59.1%, up 0.1 percentage point from September's 59.0%, pointing to slower delivery performance for the 11th consecutive month, with Five of the six largest manufacturing industries reporting slower deliveries. Trade policy deepened the planning problem: one primary metals respondent put it in three clipped sentences: “Material shortages abound. Fuel remains high. Uncertainty remains constant.” The same respondent added that “Canadian tariffs continue to have a negative impact on steel.” An executive in fabricated metal products concurred, writing that “economic policies coming out of Washington continue to weigh on business conditions and Canadian tariffs continue to damage small U.S. businesses selling into that important market.”
Localized weakness also thickened. ISM reported that 6% of manufacturing GDP contracted in October, up from 2% in September, and that the share of sector GDP in strong contraction — defined as a composite PMI of 45% or lower — rose to 6%. Spence noted that the share of sector GDP at or below 45% is “a good metric to gauge overall manufacturing weakness.” Scale matters here: The Street's analysis of the same report notes the contraction share reached roughly 85% of manufacturing GDP last December, so October's 6% reads as unevenness inside a recovery rather than the collapse the headline number might suggest.
Two respected surveys sent opposite price signals this month — and both are right
Comparing releases is one of the least-covered but most useful angles for a general reader. The S&P Global Flash US PMI, published Oct. 23 (pmi.spglobal.com), painted an economy running hot with customer-facing prices climbing at the fastest rate since August 2022 and the worst delivery delays since 2022, while the ISM survey showed its cost gauge cooling. Those are not contradictory findings; they answer different questions.
| Dimension | ISM Manufacturing PMI (October) | S&P Global Flash US PMI (October) |
|---|---|---|
| Scope | Manufacturing only | Manufacturing plus services |
| Who answers | Purchasing and supply managers | Senior executives across sectors |
| Price question | What firms pay for inputs | What firms charge customers, plus costs |
| October direction | Prices Index eased to 75.2% | Selling prices rose at the sharpest pace since August 2022 |
| Headline reading | 55.5% | Composite 57.6; manufacturing output 55.8 |
| Supply-chain signal | Slower deliveries for a month no. 11 | Delivery delays the most severe since 2022 |
| Best used for | Factory cost and order book | Economy-wide momentum and shop-shelf pricing |
The practical reading: input costs can stop accelerating while firms, finally holding pricing power after a long margin squeeze, raise what customers pay. That combination — cheaper raw material inflation, dearer final goods — is exactly the pattern that turns a factory-gate story into a household story.
Three channels that carry the news from the plant floor to your bill
- Lead time before price. When a four-week window stretches toward ten months, scarcity rather than the list price is what buyers actually pay — expect longer waits on appliances, cabinetry, vehicles, and industrial parts.
- The inflation backdrop. The Bureau of Economic Analysis reported September headline PCE at 3.6% year over year and core at 3.1%, a mark that keeps the gauge far above the Federal Reserve's 2% target (cnbc.com, Oct. 29). Factory-gate pressure typically reaches consumer baskets with a one- to two-quarter lag.
- The rate channel. The Fed held its policy range at 3.75%–4.00% in October with two dissenters favoring a 25-basis-point increase, and CME Group's FedWatch Tool was pricing roughly a 74% chance of a quarter-point hike at the December meeting (cmegroup.com). Strong factory data plus sticky prices give policymakers little reason to soften.
All of this lands on an economy that already grew in the third quarter at its fastest pace in a year, driven by corporate spending on data centers, AI infrastructure and industrial equipment — the same categories survey respondents describe as supply-constrained.
Common misreadings worth unlearning
- “Anything above 50 means all is well.” A 55.5% average coexisted in October with 6% of manufacturing GDP contracting.
- “Prices cooled, so inflation is finished.” A decelerating Prices Index at 75.2% still means far more companies paid more than paid less, for a 25th consecutive month.
- “Shrinking backlogs mean demand is dying.” The Backlog of Orders Index eased to 54.6% but stayed in expansion for a 10th straight month.
- “One index measures GDP.” Mapping the print to a 2.7% annualized increase is a regression built by ISM economic modeling, not a direct observation.
- “Factories hiring fixes the labor market.” Employment grew for a fourth month, yet growth slowed down by 0.3 percentage points — firms are staffing cautiously.
A working checklist for the next monthly release
- Compare the reading with consensus, not only with the 50 dividing line.
- Count breadth: how many of the 18 industries expanded, and how much sector GDP sits at or below 45%.
- Set Production against New Orders; output beating orders for several months usually drains backlogs and then payrolls.
- Watch Supplier Deliveries for the first real improvement — it is the gauge that decides when lead times normalize.
- Separate what firms pay from what firms charge; only the second one reaches your receipt.
- If you must buy big-ticket equipment or a renovation this year, lock quotes and delivery windows now rather than waiting for the next print.
FAQ: what general readers ask us
Why does a survey of purchasing managers matter to someone who does not work in industry?
Because purchasing managers see demand first. They place orders months before retailers stock shelves, so their answers typically lead prices and availability in goods by one or two quarters.
Is October evidence the economy is overheating?
Partly. Output is at a multi-year high, four months of hiring are adding payrolls, and backlogs remain in growth — yet 6% of manufacturing GDP contracted and capital-equipment buyers outside the AI trade are delaying purchases. This is a hot sector list inside a normal economy, not uniform excess.
Should a household change buying behaviour right now?
The rational move is timing, not panic. Goods tied to metals, energy-based chemicals and semiconductors face the most lead-time risk, so scheduling purchases early costs little; discretionary big-ticket spending, however, becomes more expensive if rates rise as the December futures pricing suggests.
Where can I check these figures myself?
The complete survey, including industry detail and respondent comments, is published by the Institute for Supply Management on ism.org and distributed as “Manufacturing PMI® at 55.5%; October 2026 ISM® Manufacturing PMI Report.” S&P Global's comparable survey sits at pmi.spglobal.com, inflation figures at bea.gov, and rate probabilities at cmegroup.com.
The call: broad recovery, narrow foundation
Our trend judgment, stated plainly: the expansion looks durable through year-end, but the risk is no longer that factories stop growing — it is that price stickiness plus policy tightening collides with a base of only 12 expanding industries. Three signposts will decide the story. If Supplier Deliveries finally turns down, lead times ease and the cost pressure loses its teeth. If the Prices Index resumes climbing, or the strong-contraction share of sector GDP rises above the current 6%, the recovery is thinner than the headline suggests. And if the December meeting brings the hike markets are leaning toward, financing costs will land on the very capital-equipment buyers who are already hesitating. Watch those three, and the monthly number stops being noise.
By James Hartley, IT Insights. For questions, corrections or to reach our editorial desk, write to contact@itinsights.com.