
Greenland ice loss: a practical guide to reading the numbers behind the 30th year in a row
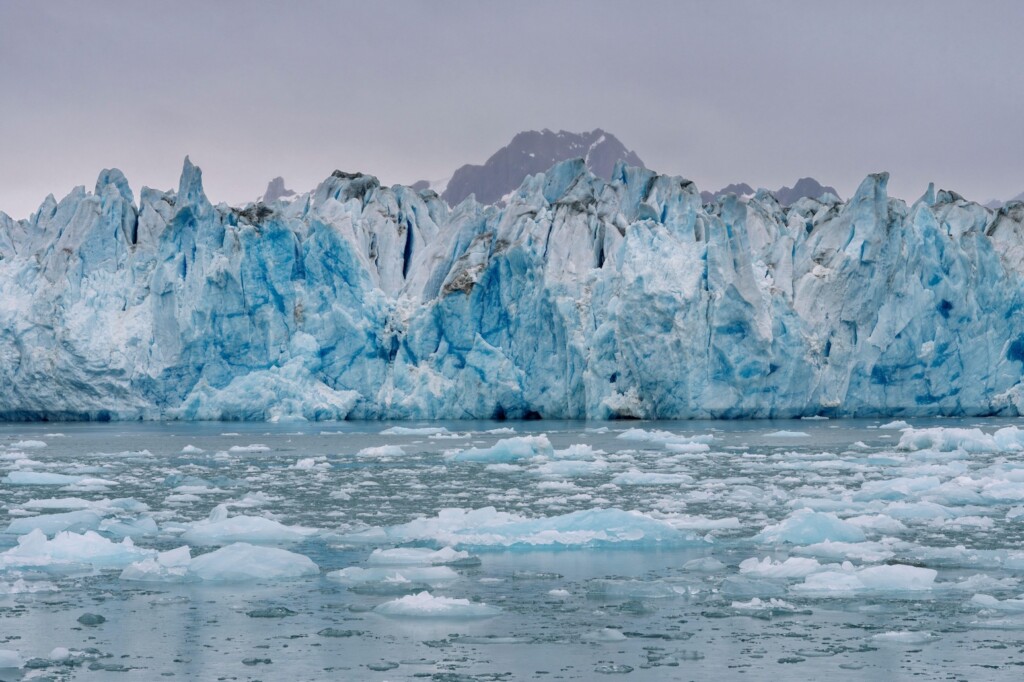
The Knud-Rasmusen glacier at Sermiligaaq Fjord, in the Ammassalik region of East Greenland. Photo: Martin Zwick / Alamy Stock Photo
Conclusion first, then the reasoning, then what to do with it. Greenland has recorded its 30th consecutive year of losing more ice than snowfall replaces. Across the 12-month period that closed at the end of August 2026, the second-largest ice sheet on Earth gave up about 135bn tonnes of ice. Nobody needs another alarming statistic; what helps is a repeatable way of reading these annual read-outs, so this guide unpacks the season in six steps, adds the misreadings to avoid, a checklist and a short FAQ.
The uncomfortable part is not the size of the loss. This was a cool start to summer, with less surface melt than in several earlier years — in other words, no 'extreme' weather year — and the ice sheet still finished deep in the red. That is what Three decades of unbroken decline look like when they arrive on an ordinary day.
The 60-second version
- Headline fact: for the 30th year in a row, Greenland's total ice budget ended negative.
- Scale: roughly 135bn tonnes lost over the 12 months to August 2026; an alternative, observation-blended estimate is larger still at 173bn tonnes.
- Counter-intuitive detail: the surface actually gained more snow than it melted, a surface mass balance of 519bn tonnes — the sixth highest in 46 years.
- Why the number is credible: 30 years is the span scientists use to isolate the fingerprint of human-caused warming from natural variability.
- Why it reaches you: the Greenland and Antarctic sheets together now account for almost one-quarter of observed global sea level rise, which is a coastal-cost, insurance and infrastructure issue, not a scenery issue.
Step 1: Identify which "balance" a figure describes
Almost all confusion in this subject comes from one habit: everything gets shortened to "ice loss", while the science keeps separate accounts.
The surface mass balance is the gap between snowfall gains and surface melt losses. The ice sheet accumulates mass through the colder months of autumn, winter and spring; from around mid-June, rising temperatures push melting above snowfall. Ice also leaves the sheet when glaciers break off, or calve, into the sea, and when glacier fronts melt on contact with warm seawater — those two channels form the marine mass balance. A small amount of melting occurs at the underside of the ice, called the basal mass balance. Combine all three and you get the total mass balance, the only account that decides whether a year is a gain or a loss.
| Account | What it counts | Result for 2025-26 | How readers misread it |
|---|---|---|---|
| surface mass balance | Snowfall in, surface melt out | Positive — 519bn tonnes | Taken to mean the ice sheet grew |
| marine mass balance | Calved icebergs plus front melt in warm water | Negative — the dominant loss channel | Taken to mean a floating berg instantly adds sea level |
| basal mass balance | Melt at the base of the ice sheet | Small, negative | Rarely mentioned at all |
| total mass balance | Surface + marine + basal | Negative — about 135bn tonnes | Treated as one agreed number when methods differ |
Two calendar traps sit underneath every figure. Greenland's ice cycle runs from 1 September to the end of August, so an "annual" value is not a calendar year. And in the charts, labels for the period 1 September to 31 August are named by the finishing year: a label of 1987 means 1 September 1986 to 31 August 1987.
Step 2: Place the season on the long record
Greenland ended 2025-26 with an overall surface mass balance of 519bn tonnes — the sixth highest value in a dataset spanning 46 years, and about 178bn tonnes above the 1981-2010 average of roughly 350bn tonnes, as tracked by the Danish Meteorological Institute's Polar Portal service.
The method matters as much as the number. The 135bn tonnes figure comes from the approach used in previous Carbon Brief analyses of Greenland ice cover, which averages three climate models. This year's update adds, for the first time, a second estimate built on data from one climate model combined with automatic weather stations, satellites, GPS data and observations from planes. That version puts the 2025-26 loss higher, at 173bn tonnes.
| Estimate | Basis | 2025-26 result | Best use |
|---|---|---|---|
| Averaged model approach | Average of three climate models | 135bn tonnes | Year-to-year comparability |
| Observation-blended approach | One climate model plus weather stations, satellites, GPS and aircraft data | 173bn tonnes | Testing whether models under-report |
Why the gap? Scientists still have incomplete information about how thick the ice sheet is, how fast it moves and how quickly its surface melts, and each group accounts for those uncertainties differently. Treat the range as honest science, not as a contradiction.
The map below compares the 2025-26 surface mass balance against the 1981-2010 average: blue marks ice gain, red marks ice loss.
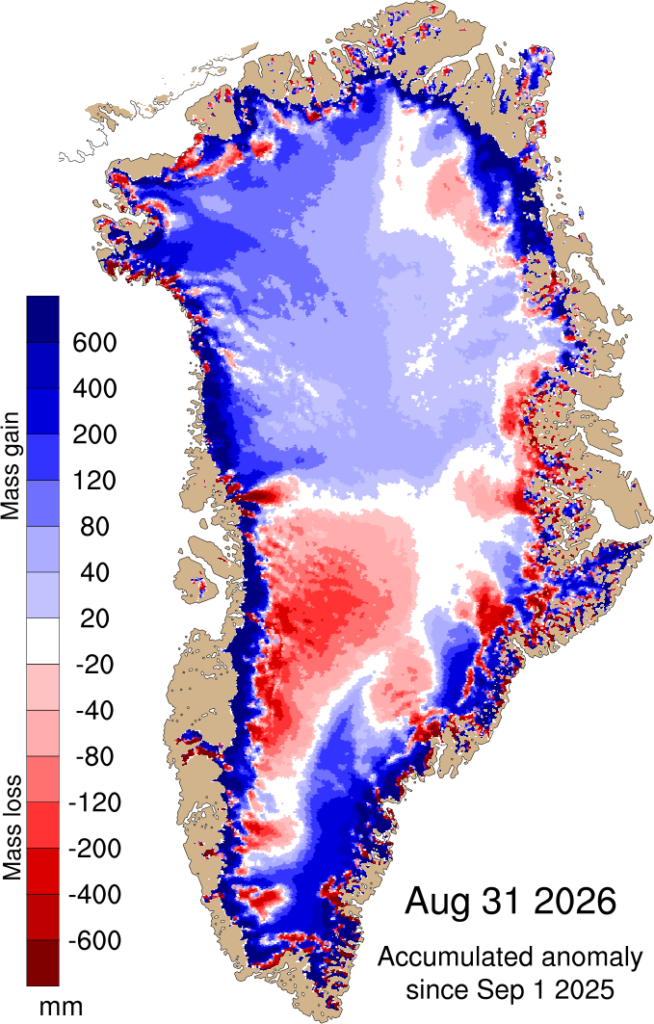
Difference between the annual surface mass balance in 2025-26 and the 1981-2010 period, in mm of ice melt. Blue is gain versus average, red is loss. Credit: Polar Portal.
The paired charts show the surface balance day by day and cumulatively. The practical reading is a simple sequence: Greenland gained ice from September 2025 through May 2026, then began losing it from June onwards. Grey shows the 1981-2010 average and its variability; the red line is the record-low year of 2011-12.
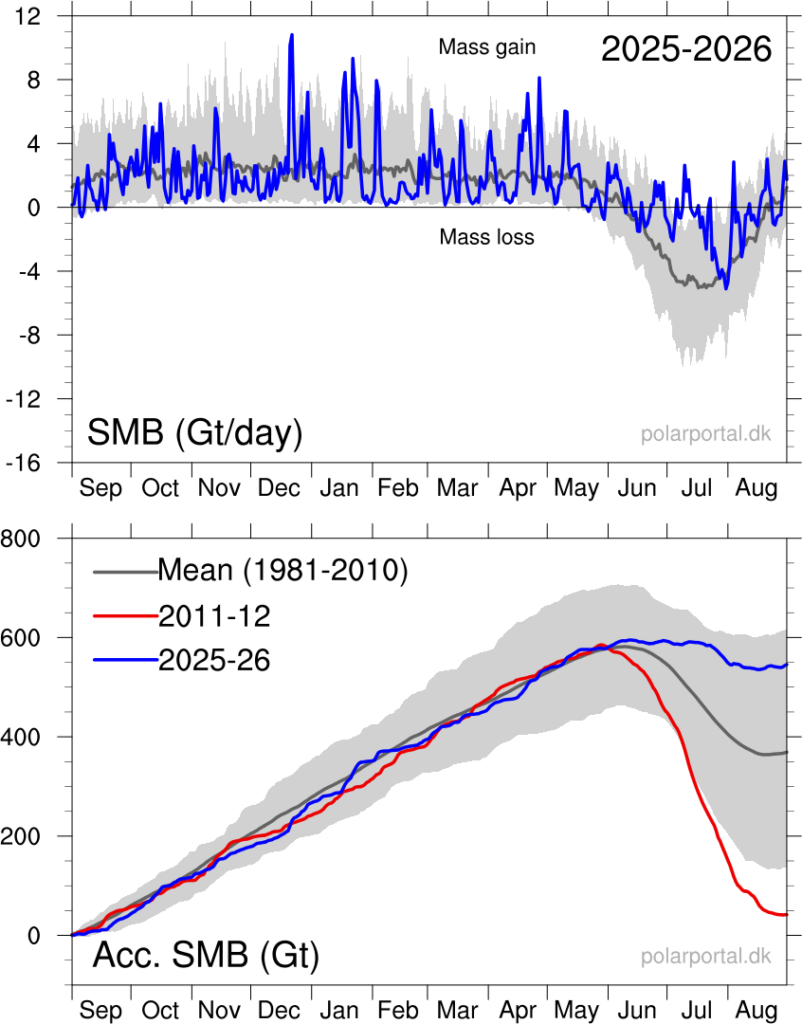
Daily (upper) and cumulative (lower) surface mass balance of the Greenland ice sheet, in billions of tonnes. Blue: the 2025-26 balance year; grey: the 1981-2010 average and variability; red: 2011-12. Credit: Polar Portal.
Longer series make the milestone visible. The total balance record since 1985 shows 2025-26 as the 30th consecutive year of ice loss, with 1996 the last year that ended in an annual net gain.
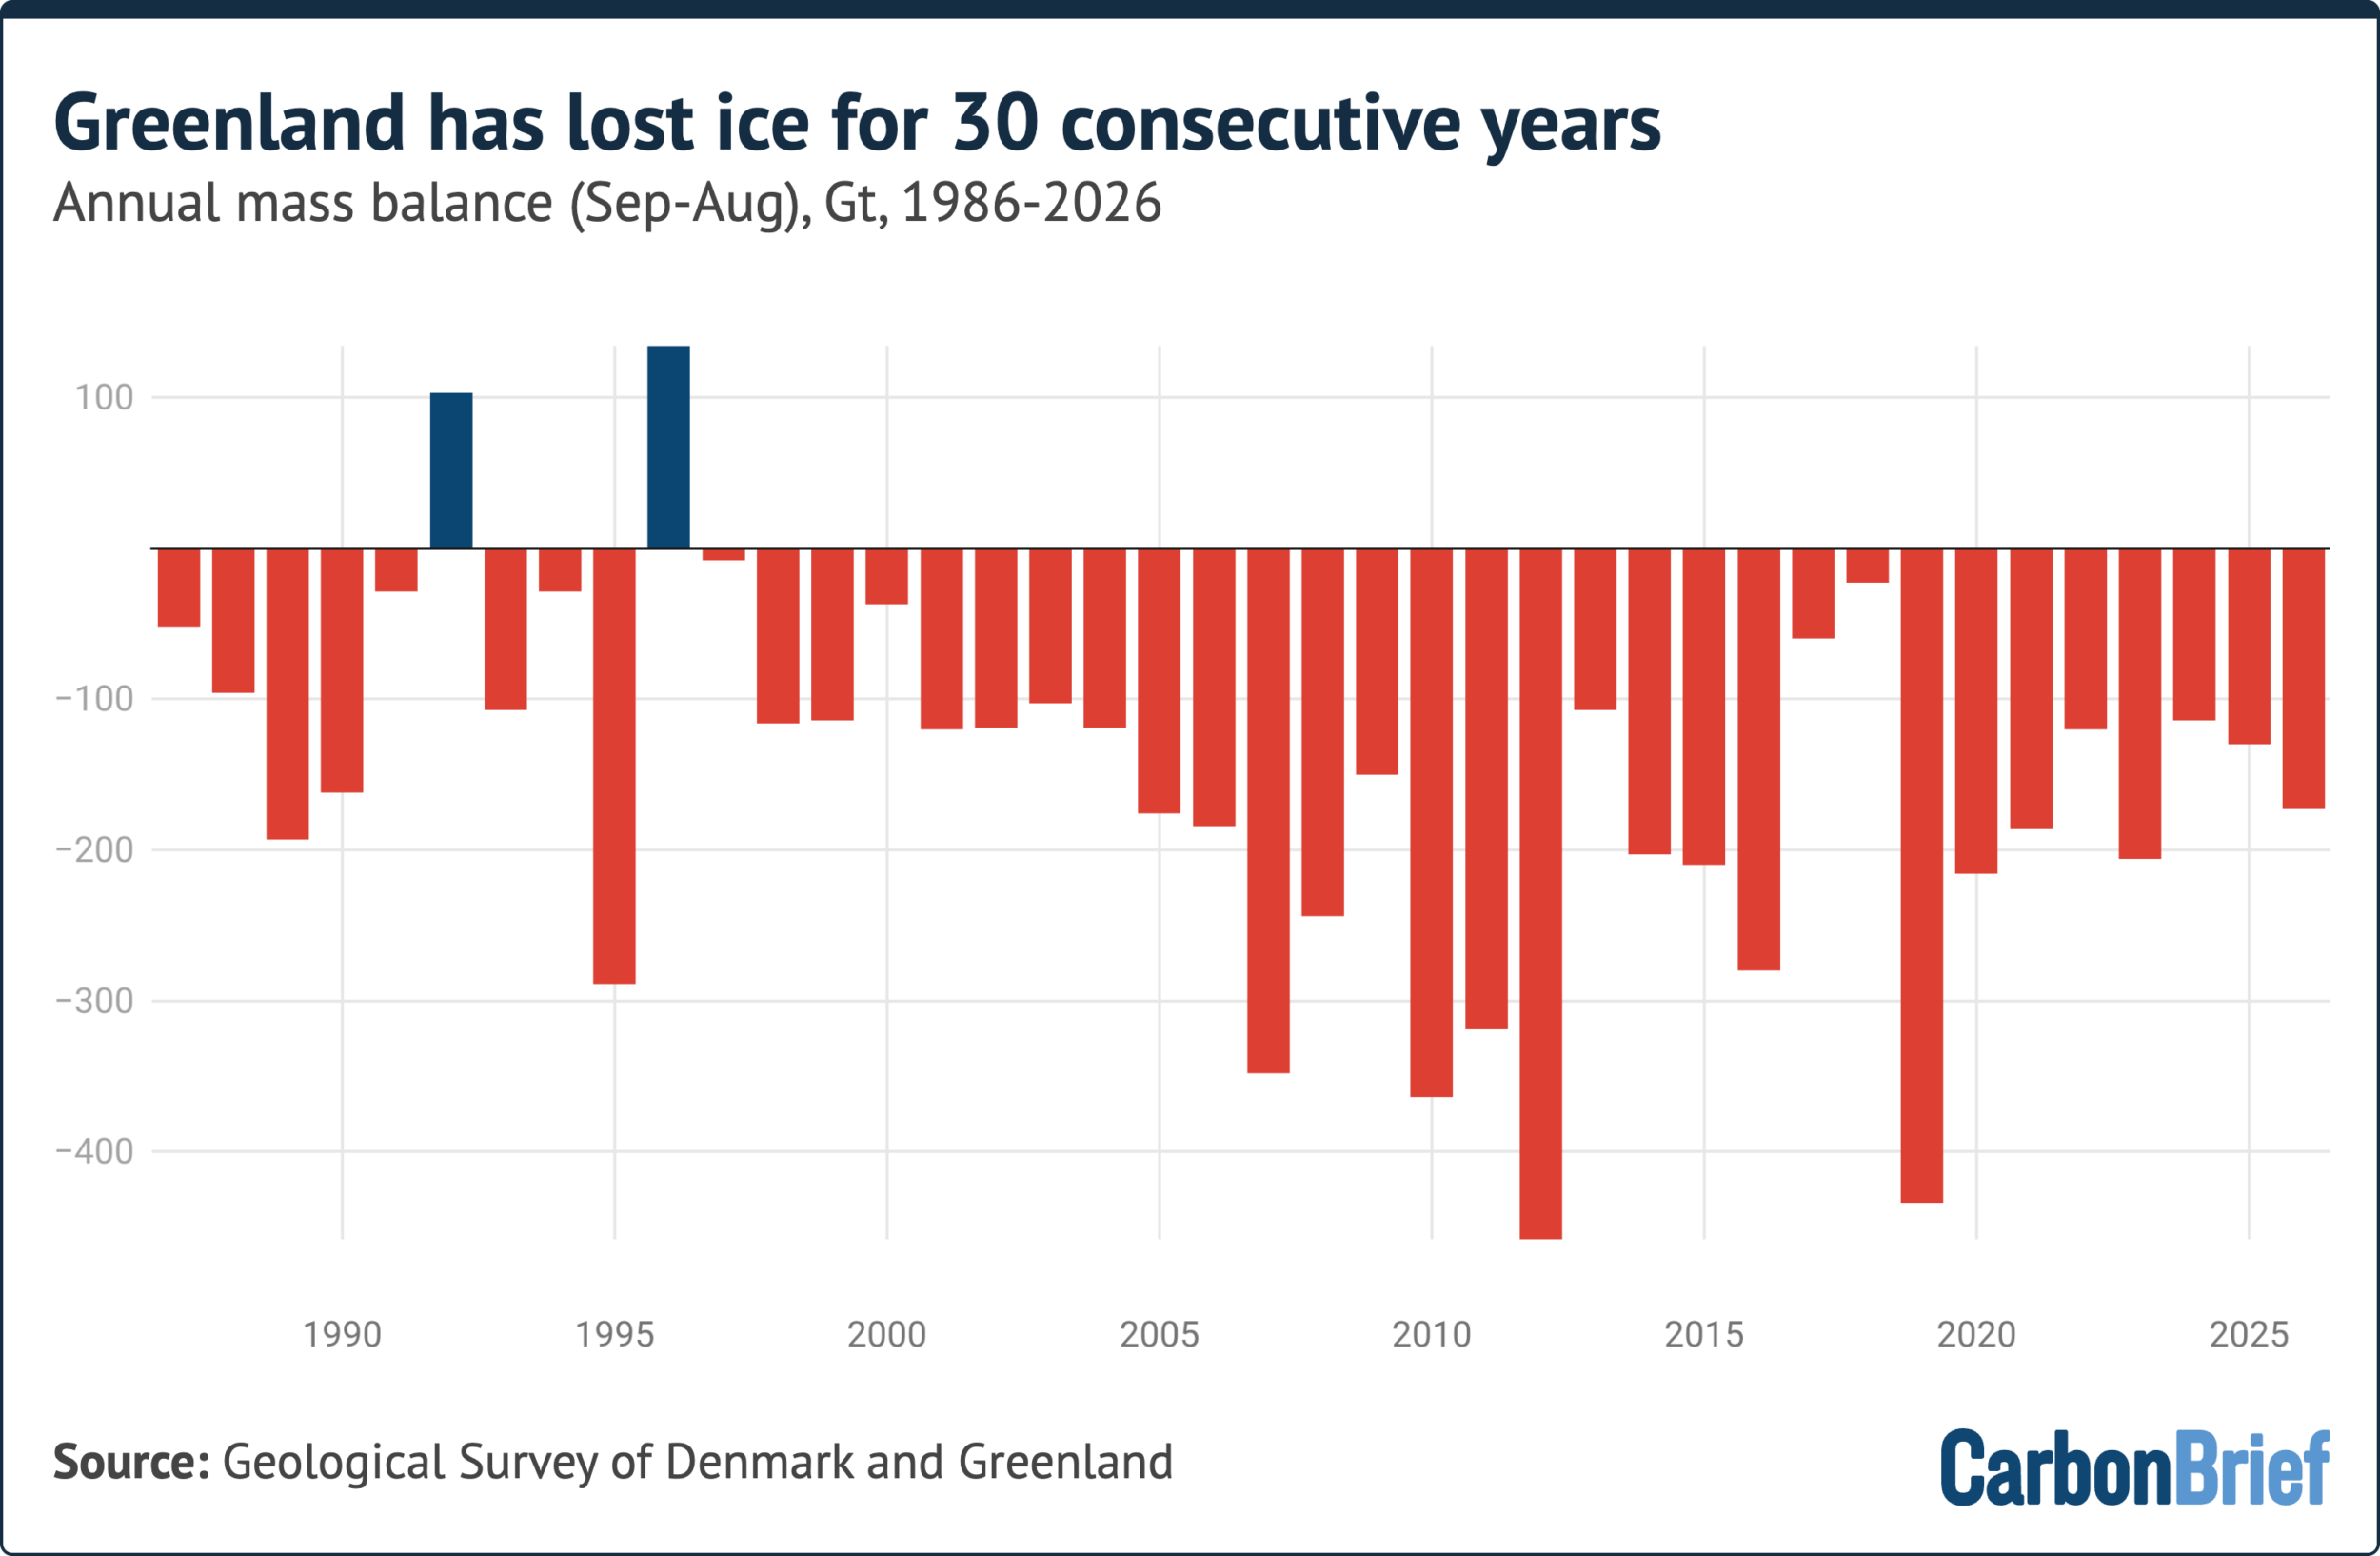
Labels on the x-axis denote the period 1 September to 31 August, where 1987 covers 1 September 1986 to 31 August 1987.
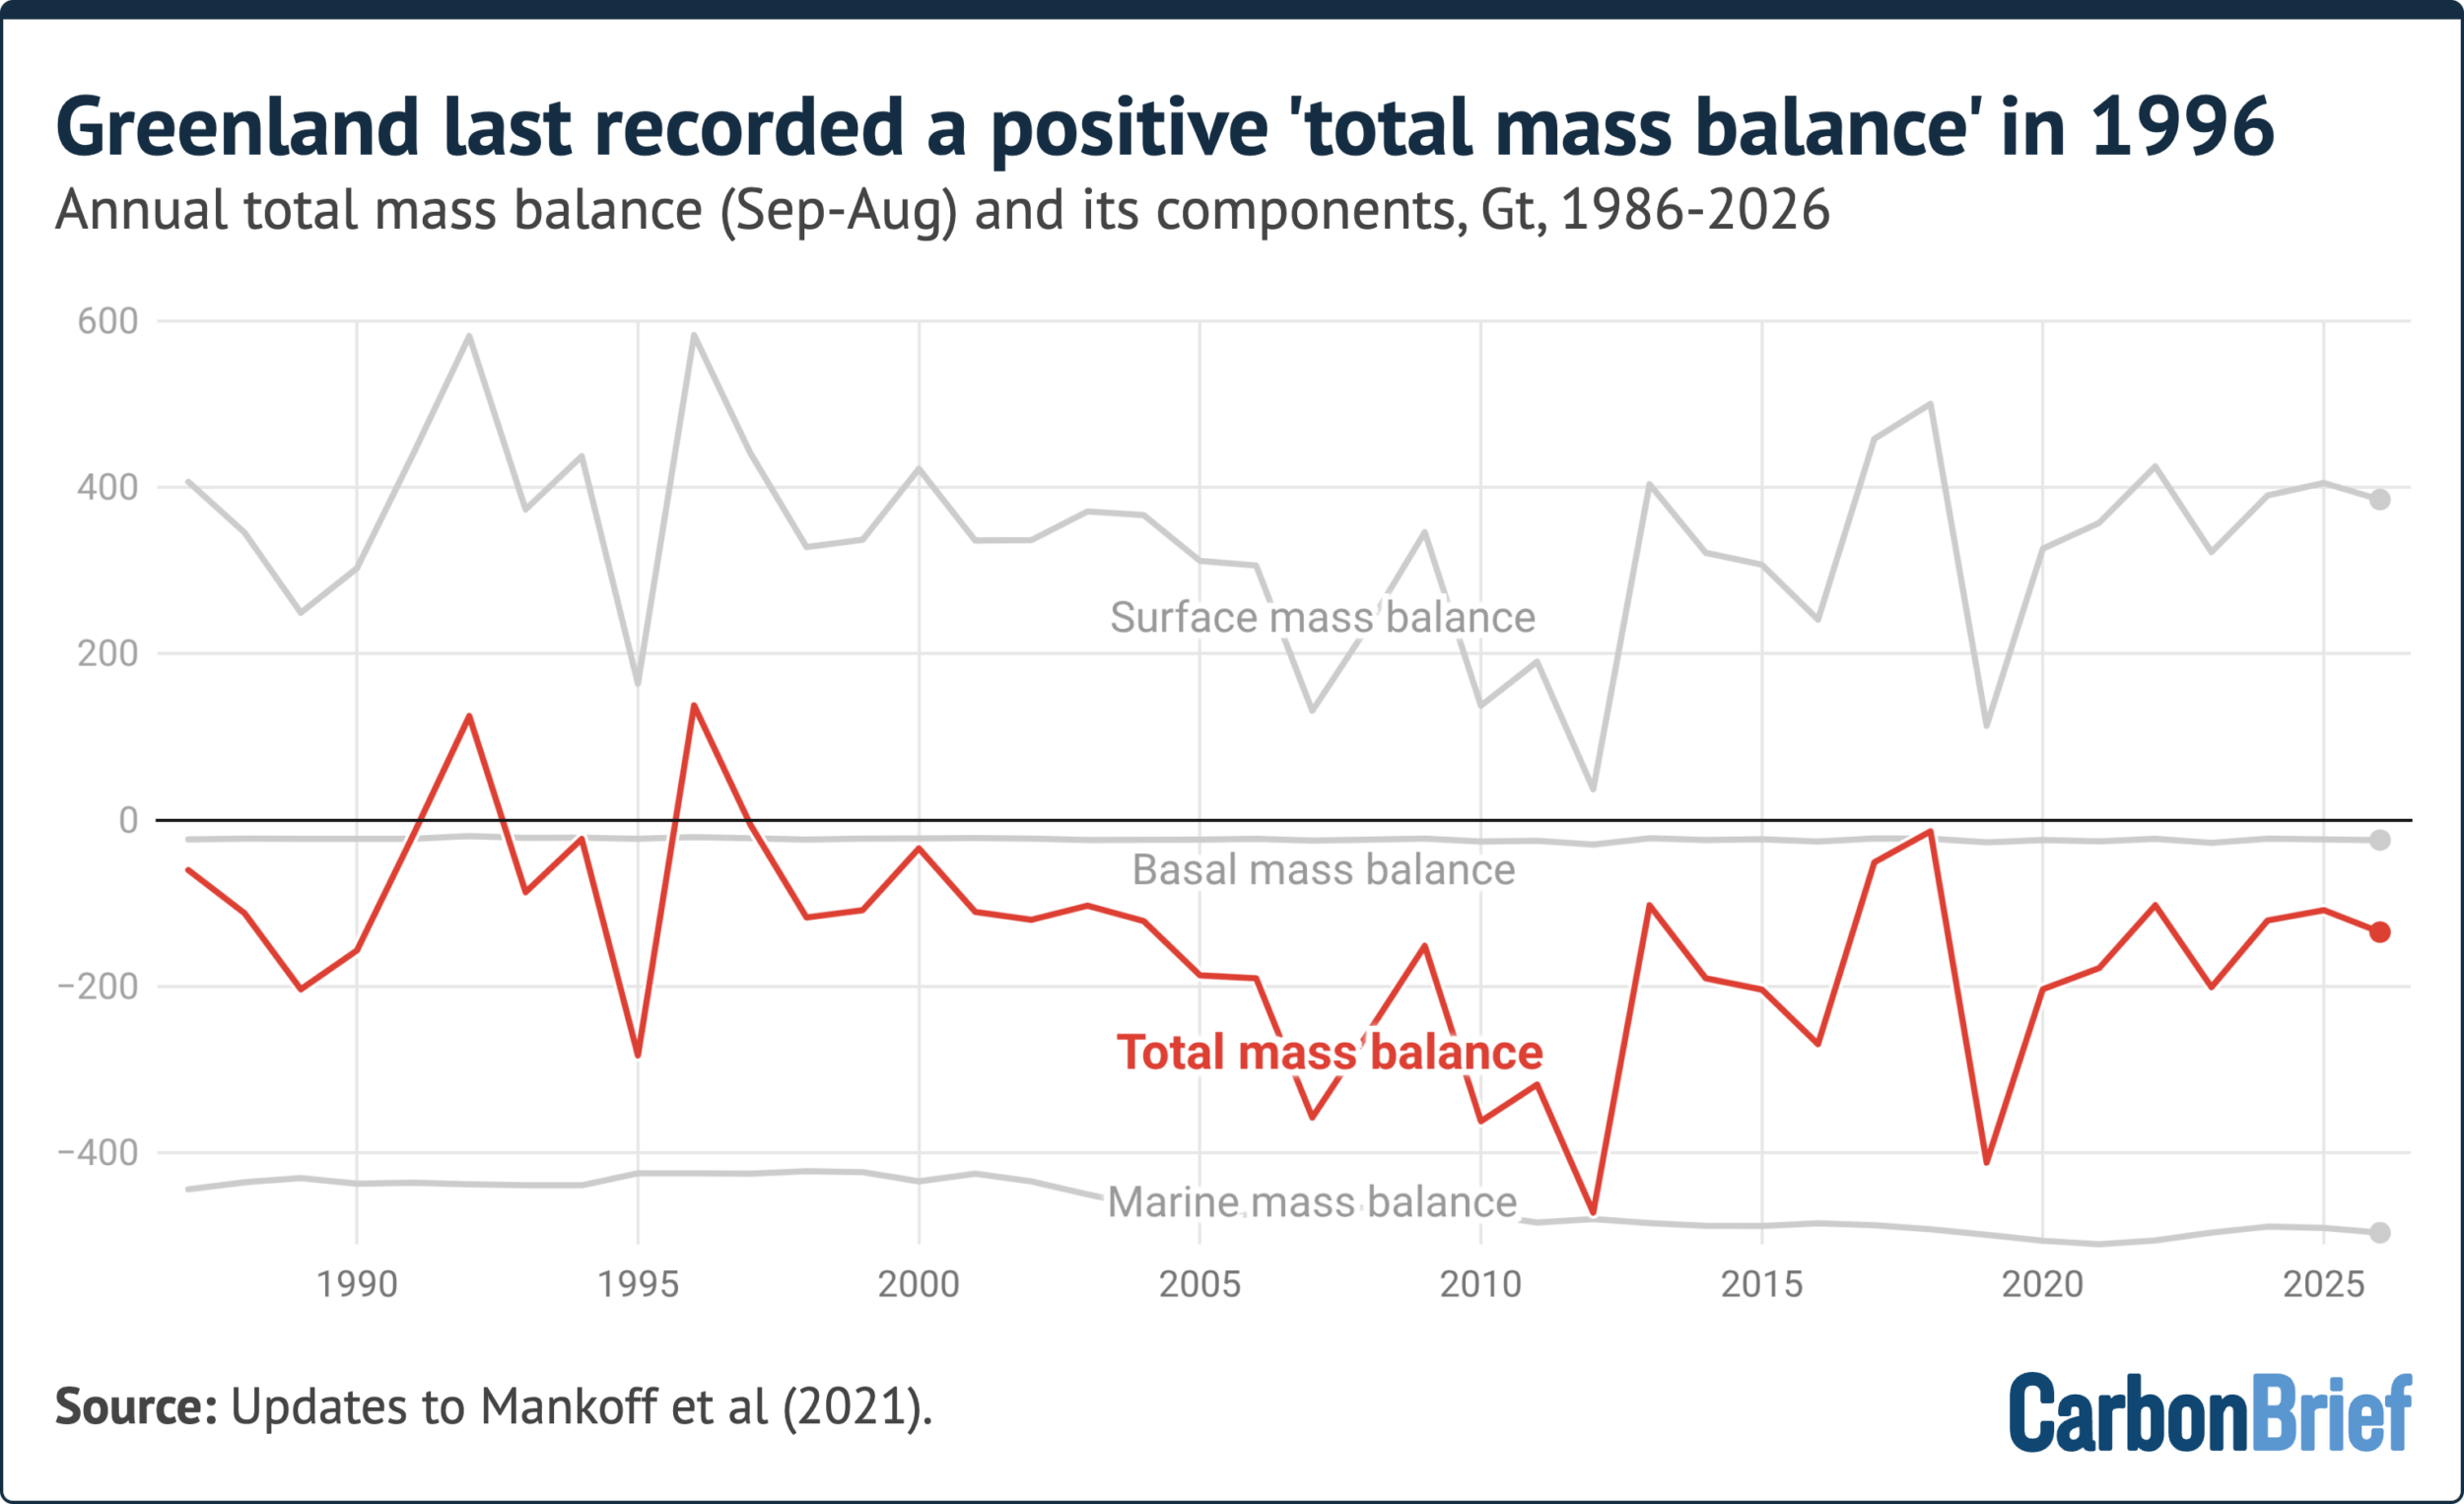
Surface, marine and basal components combined into the ice sheet's total mass balance (red), since 1985. Labels on the x-axis denote the period 1 September to 31 August, where 1987 covers 1 September 1986 to 31 August 1987.
Step 3: Follow the weather storyline of the season
Winter and early spring in 2025-26 were unusually dry across the southern half of Greenland, leaving roughly 40bn tonnes less snow on the ice sheet than normal. Dry winters usually forecast heavy melt, because a deep snow layer behaves like a shield in the early part of the year. This time the expectation failed: the start of summer was relatively cool, with frequent snowfall and extensive cloud cover limiting how much sunlight could warm the surface when solar radiation is normally at its strongest.
Here is the definition worth keeping: the onset of the melt season is the first of at least three consecutive days with melting over more than 5% of the ice sheet. In 2026 that came on 5 June, nine days later than the 1981-2010 average. From the end of June, warm and sunny conditions took hold. During the first 20 days of July melting ran well above the 1981-2020 average, and on 22 July it covered 74.9% of the ice sheet — roughly three-quarters of its area. For comparison, July 2025 still holds the record, when 81.2% of the continent melted simultaneously.
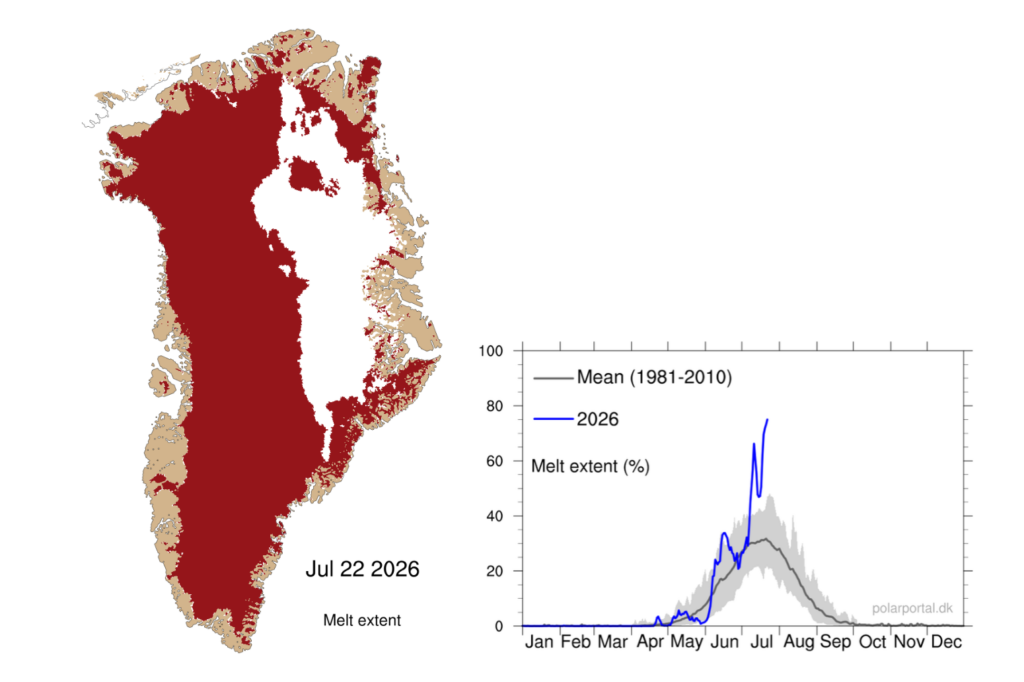
Areas of Greenland undergoing surface melt (red shading) on 22 July 2026, with the daily melt-area percentage (blue) set against the 1981-2010 average (grey). Credit: Polar Portal.
Two more reading tips. First, the fresh June snow built a cold, bright buffer that reduced later summer melt and runoff. Second, despite above-average melting, the surface balance stayed almost flat from mid-June to mid-July and was only slightly lower by the end of August, because much of the meltwater percolated into the snow below and refroze.
Snowfall tells a similar story. South-east Greenland is normally the wettest part of the ice sheet and did not disappoint, but the west coast north of Nuussuaq also received significant snow this year — unusual for that sector. Fresh snow is brighter than old glacier ice, so it bounces more solar energy back to space. Simultaneous rises in snowfall and melt are exactly what a warming climate predicts: warmer air holds more water vapour, while higher temperatures liberate more melt.
Step 4: Watch the margins, where the single biggest events land
The most dramatic loss of 2025-26 happened at the edges. On 4 August, a vast tabular iceberg — an 'ice island' with nearly vertical sides and a flat top — broke away from the floating ice tongue of Petermann glacier in north-west Greenland.
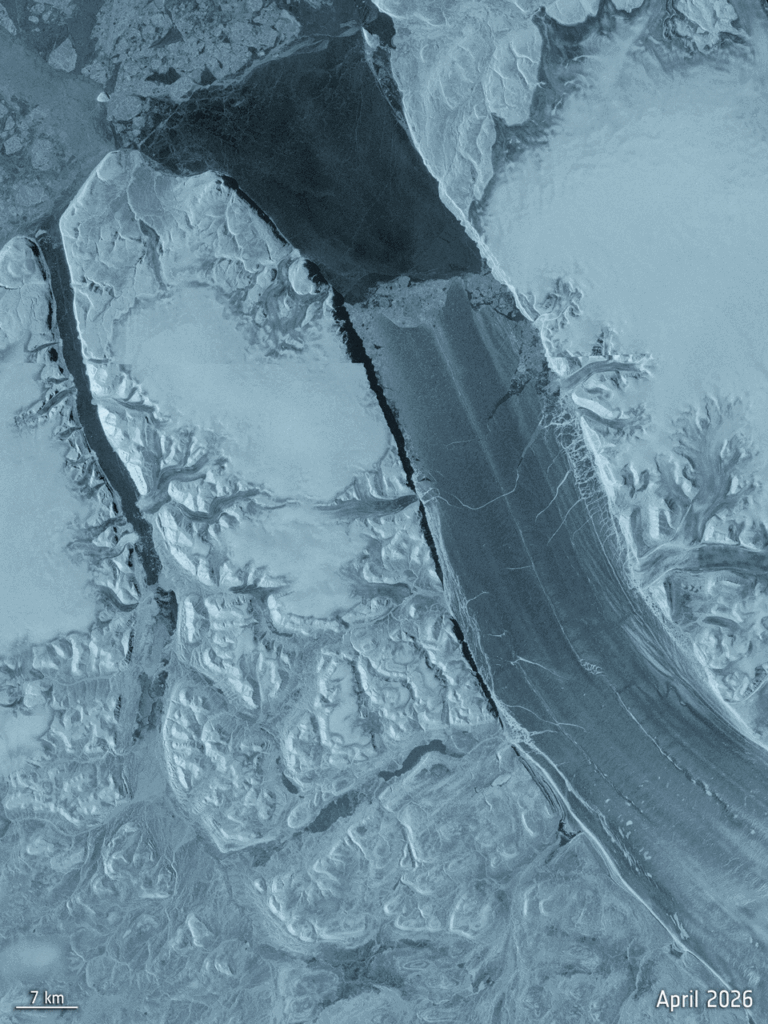
Sentinel-1 image sequence of the Petermann ice island, before and after the 4 August 2026 calving. Credit: ESA/Copernicus.
When you check any calving claim, ask for three quantities: area, thickness and an understandable equivalent. This one measured more than 76 square kilometres (km2) with an estimated thickness of 150 metres — enough frozen water to cover greater London to a depth of 6.65m. It was the largest loss of floating ice at Petermann since 2012 and the biggest calving event by any Arctic glacier since 2020.
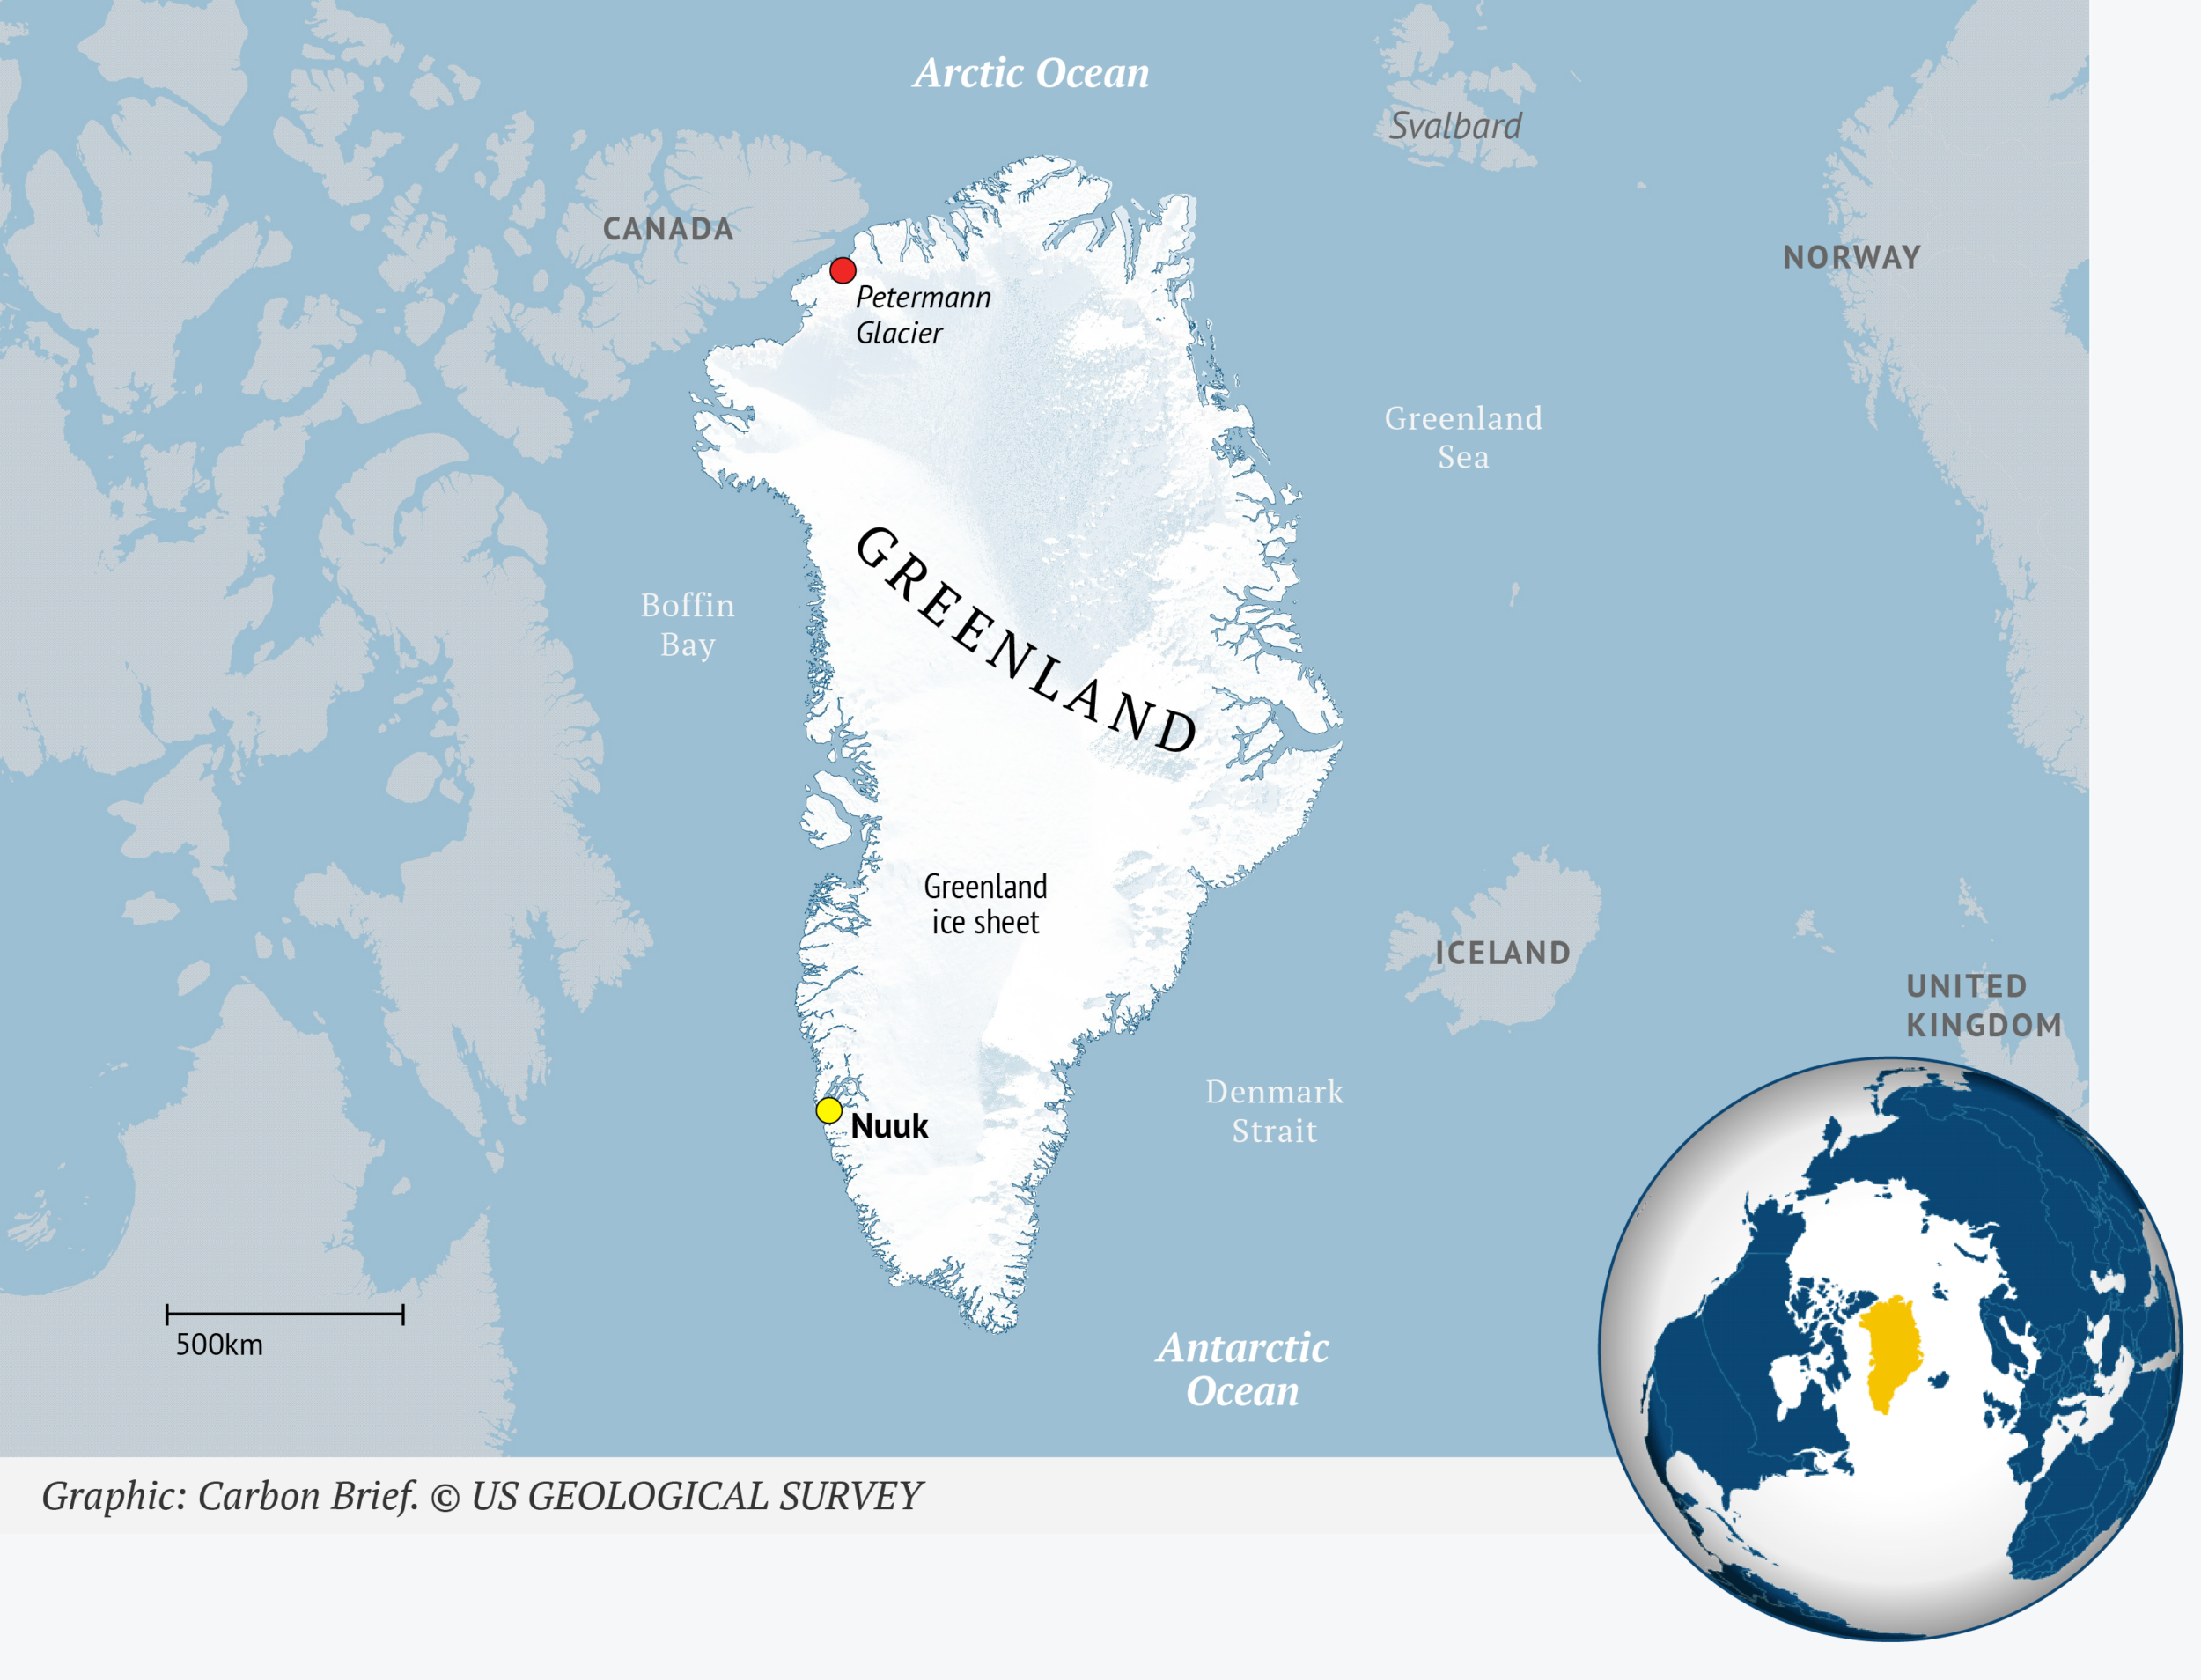
Similar breakoffs occurred in 2010 and 2012, and this one had long been expected as cracks widened across the tongue over several years. Scientists anticipate more: two further ice islands, estimated at roughly 94 and 84km2, should detach as existing rifts continue to cut through. Together the three would remove about 22% of Petermann's remaining floating ice.
The nuance most summaries skip: the tongue is already afloat, so this calving does not directly raise sea levels. Petermann is nevertheless one of Greenland's largest marine-terminating glaciers, and a floating tongue props up the glacier behind it, acting as a brake on ice flowing from the interior to the ocean. Research on Petermann published in the journal The Cryosphere documents how losses of such buttressing tongues can speed the discharge of grounded ice. Overall, calving and glacier retreat have driven roughly two-thirds of total ice loss on the continent.
Step 5: Ask what the rest of the hemisphere's weather did
Greenland's high surface balance has an outside explanation — the hot summer in Europe. Multiple heatwaves were observed across southern Europe and North America during the summer of 2026, with temperature records set in several countries.
When blocking high-pressure systems park in place, they bend the jet stream, the fast west-to-east winds high in the atmosphere, into the shape of the Greek capital letter Omega (Ω). Warm air settles near the cores of those highs, while cool, wet conditions collect at the 'feet' of the Ω. Greenland sat on the cool side this year. Displace that pattern by half a wavelength and the ice sheet would probably have met record-melt conditions instead, ending with a lower surface balance.
Step 6: Zoom out to the sea-level ledger
A new assessment confirms that Greenland's losses are the largest single ice-sheet contribution to global sea level rise. The Ice Sheet Mass Balance Intercomparison Exercise (IMBIE) combines 42 independent estimates of ice-sheet mass change from satellite gravimetry, altimetry and the input-output method — including the Danish Meteorological Institute surface mass balance figures described above — into one record. Published in the journal Scientific Data in September, it reports that Greenland and Antarctica together lost 11,309bn tonnes of ice between 1979 and 2023, raising global sea levels by around 32mm.
The two sheets now account for almost one-quarter of observed sea level rise, and Greenland dominates that tally: 6,215bn tonnes lost between 1972 and 2023, an average of 119bn tonnes per year, with two-thirds of the loss from increased ice discharge and one-third from a reduced surface balance as melt intensified. Annual losses accelerated from around 60bn tonnes in the 1980s to 264bn tonnes in the 2010s. Antarctica lost 4,780bn tonnes over the same period, about 13mm of sea level, entirely from discharge concentrated in west Antarctica. East Antarctica has so far remained relatively stable, with record snowfall even producing a small mass gain.
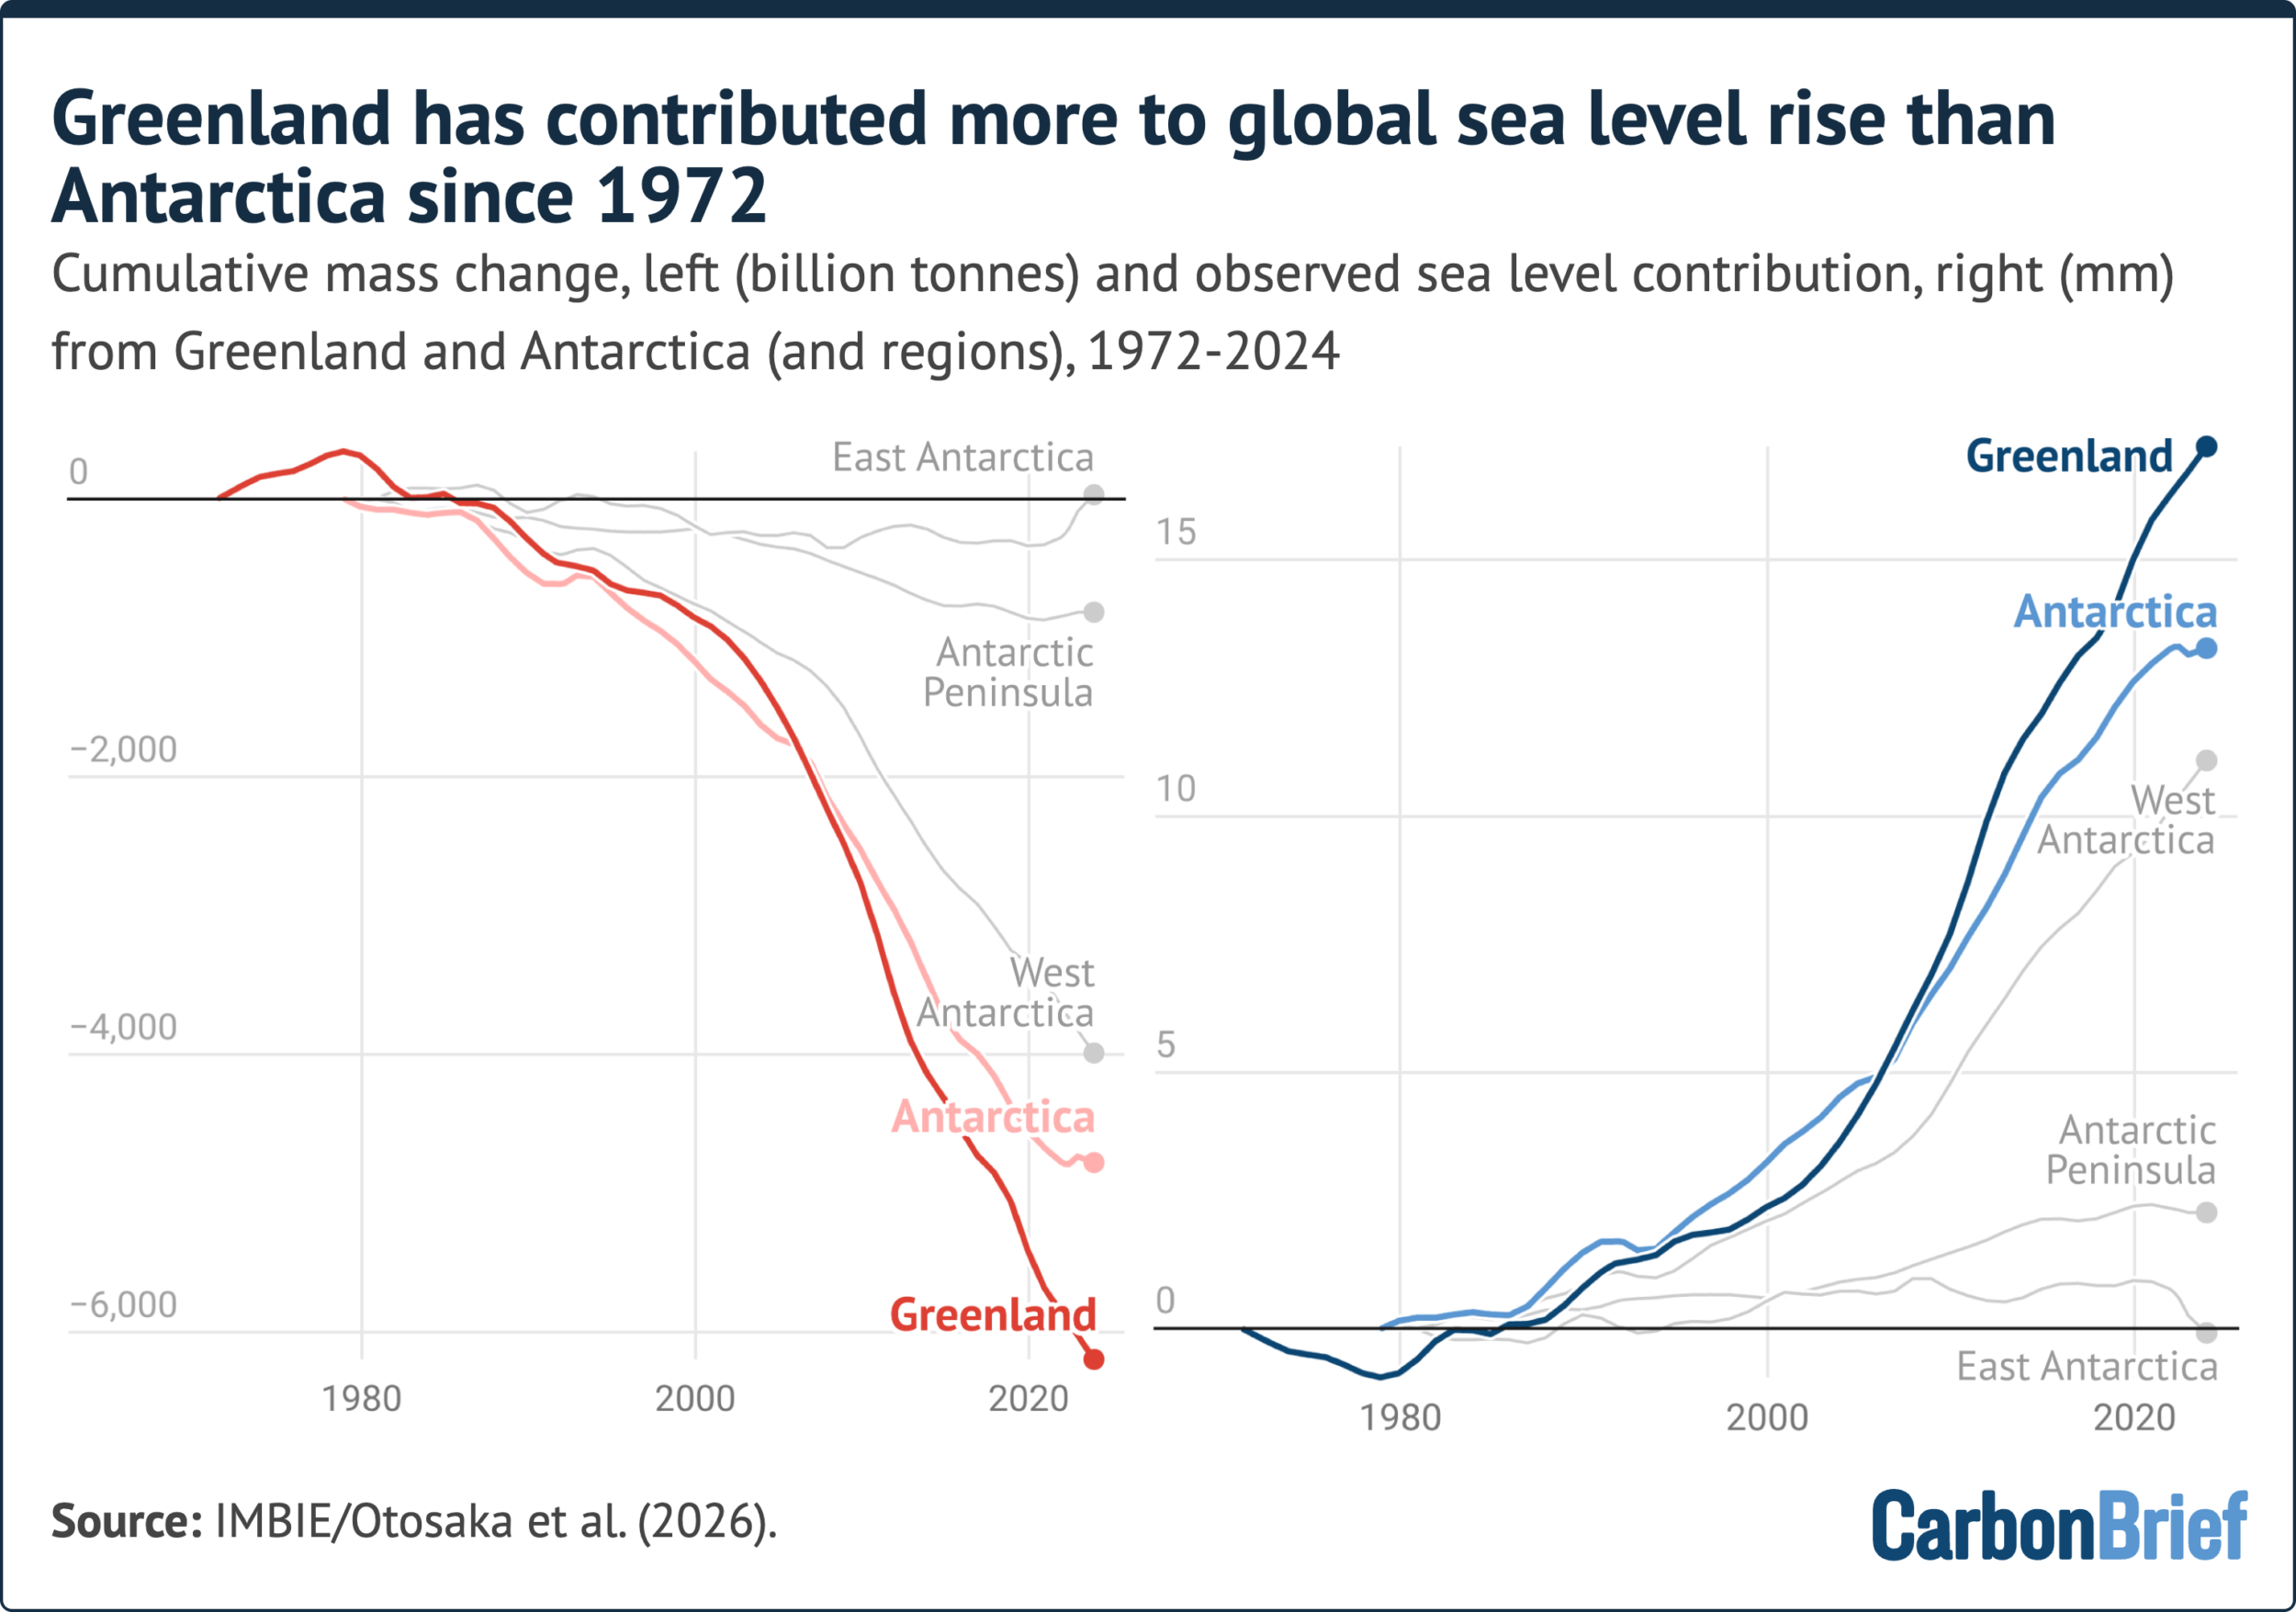
That division is expected to shift. Greenland's losses to date amount to only a few centimetres of rise, but the Antarctic sheet is roughly 10 times larger and could produce far more in future. IMBIE notes that Antarctica's losses are dominated by marine-terminating glaciers whose stability is hardest to predict. The processes increasingly observed there — growing surface melt, shrinking sea ice, losing ice shelves and seasonal retreat of outlet glaciers — have been standard in Greenland for decades. Analysts call this the 'Greenlandification' of Antarctica: Greenland is not only the biggest present-day source of ice-driven sea level rise, but a preview of what the larger ice sheet at the other end of the planet may do.
Why "30 years" is the threshold that changes the argument
A single year, however dramatic, is weather. An extreme melt summer — or an unusually cold, snowy one — says little on its own about a long-term trajectory. This is why climate scientists reach for 30-year periods; the World Meteorological Organization formalises the same logic, defining climatological standard normals as averages computed over consecutive 30-year stretches, a convention the agency revises each decade.
Thirty years of observations are normally what it takes to separate the fingerprint of human-caused climate change from natural climate variation. In Greenland the annual direction has pointed downward every single year for 30 years. The biggest single-year loss remains 2012, when around 458bn tonnes disappeared from the ice sheet. The past two years were moderate by comparison — yet even these 'quiet' years each produced losses of more than 100bn tonnes. That record is why scientists can now say with confidence that Greenland's mass loss is driven by climate change.
Two additions that make the number actionable
First, the sink you are measuring into is speeding up. NOAA's National Ocean Service currently describes global mean sea level as rising at about 3.2mm per year, while the Copernicus climate indicator series reports the trend strengthening from 2.92mm per year over 1999-2009 to 3.82mm per year over 2015-2025 — a 30.8% increase. Research published in Nature Communications Earth & Environment in 2024 found the satellite-era rate roughly doubled between 1993 and 2023.
Second, part of the bill is already committed. A 2022 study in Nature Climate Change concluded that ice already lost from Greenland locks in at least about 27cm of future global sea level rise even if greenhouse gas emissions were to stop immediately. Read a 30th consecutive year of decline as another instalment paid into that locked-in account, rather than as one more data point.
Common misreadings to avoid
- "The surface balance was the sixth highest in 46 years, so the ice sheet recovered." No: the surface account has always ended positive because snowfall still outruns surface melt. The total mass balance is what went negative, by about 135bn tonnes.
- "Two estimates disagree, so the science is unreliable." The 135bn tonnes and 173bn tonnes figures reflect different treatments of ice thickness, flow speed and melt rate. Ranges are the expected output of incomplete data.
- "A giant iceberg melting means instant sea level rise." Floating ice already displaces its own volume. The risk lies in removing the buttressing that slows inland ice from reaching the ocean.
- "A cool, snowy year breaks the trend." 2025-26 had a late melt onset, heavy cloud and refreezing — and still ended in loss, as every year has since 1996.
- "The figures cover 2026." They cover 1 September to 31 August, so a value labelled 2025-26 begins in 2025 and mostly reflects conditions through the following summer.
A checklist you can run on any future headline
- Name the metric. Surface, marine, basal or total mass balance — only the last one settles whether a year gained or lost.
- Find the baseline. Ask what the 1981-2010 average is and how far the year sits from it; "high" and "low" are meaningless without it.
- Check the method and its range. Model averages, satellite gravimetry, and station-blended estimates disagree by tens of billions of tonnes.
- Separate weather from pattern. A cool start to summer, an Omega-shaped jet stream or one dry Winter can move a single season; the record since 1985 is what carries the signal.
- Convert to your decision. If you evaluate coastal property, shipping routes, flood insurance or municipal budgets, translate the annual number into the local sea level trend published by national tide-gauge and satellite services, and remember the committed rise that cannot be avoided by cutting emissions now.
- Watch the gates. Track marine-terminating glaciers such as Petermann, where a single week of calving can outweigh months of surface melt.
FAQ
Is Greenland losing ice every single year now?
On the total balance, yes, for 30 years running. 1996 is the most recent year that ended with a net gain of ice.
How can snowfall increase while ice disappears?
Warmer air carries more moisture, so more of it falls on the ice sheet — the only route by which the sheet gains mass. But warmer air also melts more ice, and melt plus discharge still exceeds accumulation.
Why do published loss figures for the same year differ?
Because ice thickness, velocity and surface melt rates are not fully observed, and each research group handles those unknowns differently. That is why an average of three climate models and an observation-blended approach give 135bn tonnes and 173bn tonnes for 2025-26.
Does this year's melt raise sea levels on its own?
No year does. The signal is cumulative: 11,309bn tonnes lost by both polar sheets since 1979 has already contributed about 32mm of global mean rise.
Where can I verify the numbers myself?
Start with the Danish Meteorological Institute's Polar Portal for daily surface balance, the IMBIE record published in Scientific Data for the long sea-level accounting, the WMO's guidance on 30-year climate normals for the statistical framing, and ESA/Copernicus Sentinel-1 imagery for individual calving events.
Prior coverage of this annual read-out includes editions from 2025, 2024, 2023, 2022, 2021, 2020, 2019, 2018, 2017, 2016 and 2015, and their shared method is the reason the current figure can be compared line by line with earlier years.
Bottom line for a general reader: the interesting fact is not that Greenland lost ice again, but that a mild year could not stop the streak. Learn to tell the four accounts apart, insist on the baseline and the method, and you can judge any future headline in a minute instead of taking it on faith.
Analysis and editing: James Hartley, IT Insights — questions and corrections: contact@itinsights.com