
Gas Shock, Not Green Taxes: Why nearly 90% of UK Electricity-Bill Growth Since 2020 Is a Household Problem
If a household electricity bill has moved upward, the first job is to separate fuel from folklore. The new Nesta analysis shared with Carbon Brief attributes nearly 90% of the rise in UK household electricity bills since 2020 to wholesale costs, which in Britain are still heavily exposed to gas. For gas bills, the share attributed to wholesale gas is 77%. The practical lesson is simple: bill literacy should start with the wholesale market, then move to networks, policy and supplier costs.
Why the gas shock matters more than the green-tax debate
Carbon Brief reported in January 2026 that, since before the 2022 global energy crisis, two-thirds of the rise in electricity bills was already traceable to high gas prices. With conflict continuing in the Middle East, wholesale gas prices are now at their highest levels since Russia’s 2022 invasion of Ukraine. As of 19 October, UK wholesale gas prices were 220p per therm (£75 per megawatt hour, MWh), higher than the 2022 average of 210p/therm (£72/MWh).
After accounting for inflation, the figure below shows typical UK annual household electricity bills had risen £180 by the fourth quarter of 2026 compared with the same period in 2020.
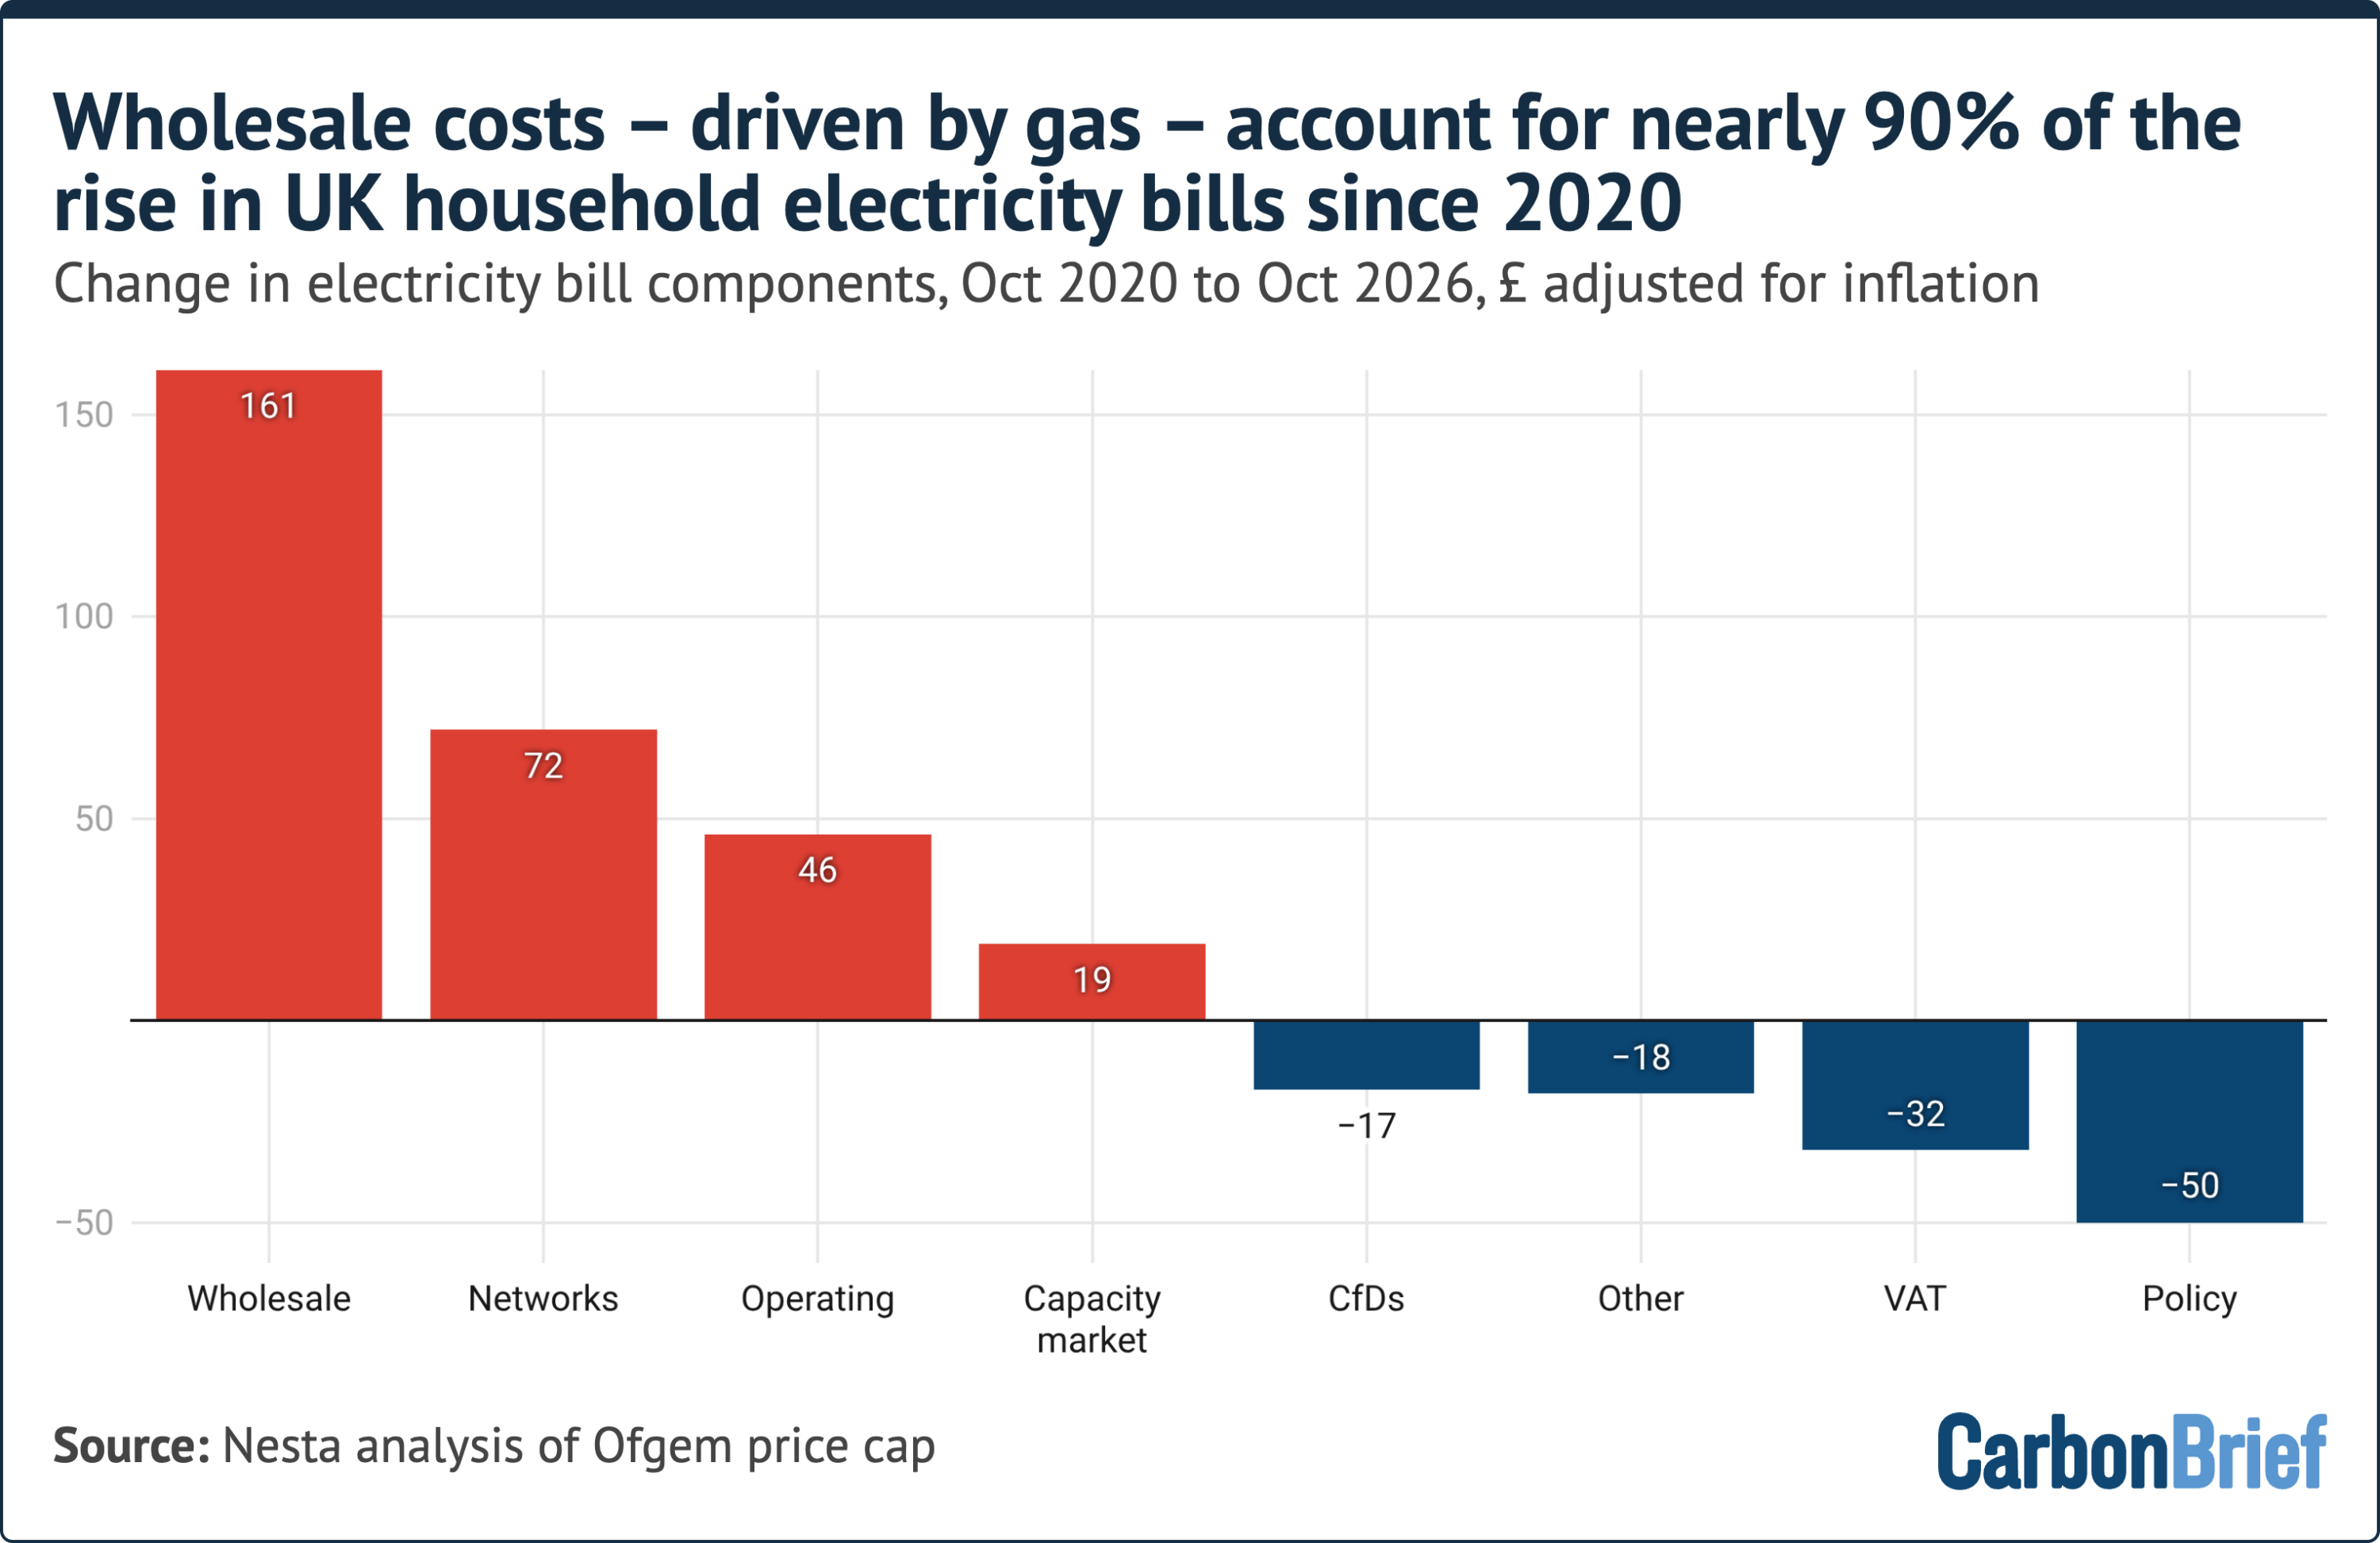
Wholesale costs, driven by the price of gas, account for 90% of this increase (£161). Andrew Sissons, director for sustainable future at Nesta, says net-zero is, in fact, “helping to shelter Britain from the impact of expensive gas”. He adds:
“Rising gas prices, not net-zero, have driven most of the recent surge in Britain’s energy bills. Britain is particularly exposed, with over 80% of households connected to gas mains, while our electricity system still relies too much on gas as the marginal unit.”
The analysis follows approval by the UK government for development of the Jackdaw gas field in the North Sea, despite its statement that the project “would not…affect prices”. For readers, that mismatch is a useful warning: political supply choices and bill arithmetic are not always the same story.
Contrary to widespread perceptions, the Nesta analysis finds renewable “contracts for difference” (CfDs) are reducing electricity bills by £17 under the current price cap. The government has also cut policy costs for electricity: 75% of legacy renewable support has been moved onto general taxation, the “ECO” efficiency scheme has ended and VAT has been temporarily removed.
Read the bill in four parts
| Bill part | What the numbers show | Why households often misread it |
|---|---|---|
| Wholesale | nearly 90% of the electricity-bill rise since 2020; 90% of the £180 inflation-adjusted increase, or £161; £444 (81%) of the dual-fuel rise. | Gas moves the marginal electricity price, so policy noise feels louder than the arithmetic. |
| Network | £72 added to electricity bills since 2020; £46 goes to transmission; £21 relates to balancing; £35 (4%) of a typical £858 bill; dual-fuel network rise £127, including £55 for the gas grid. | Constraint payments get headlines, but they are smaller than the whole bill suggests. |
| Policy | Fell from £183 (16%) in October 2020 to £114 (7%) in October 2026; CfDs reduce bills by £17; 75% of legacy renewable support moved to taxation. | “Green tax” shorthand can invert cause and effect. |
| Operating | Up £46 since 2020; profits capped at 2.5%; current cap includes £291 (17%) of operating costs. | Admin costs look invisible until debt and bad-debit risk grow. |
Nesta says network costs have added £72 to typical bills since 2020, with most of that—£46—going to investment in the electricity transmission network, known as the “motorways” of the grid. Only £21 of that network-cost rise relates to balancing the system, including “constraint payments” for turning off windfarms and turning on gas plants because grid capacity is insufficient.
Wind constraint payments often receive extensive news coverage, even though balancing costs in total make up just £35 (4%) of a typical £858 annual household electricity bill.
The Nesta figures also show energy supplier operating costs have gone up by £46 since 2020. The underlying Ofgem figures do not break these costs down, but the increase is thought to be driven by the cost of rising household energy debt. Supplier profits are capped at 2.5% of bills.
The dual-fuel picture: electricity and gas are still linked, but less tightly
Household electricity prices have increased far less rapidly than gas bills since the Hormuz crisis, with higher clean-energy generation helping break the link between the two. According to Nesta’s analysis, household gas bills have increased by £368 in real terms since 2020, and 77% of that rise—£283—is due to wholesale gas costs.
After accounting for inflation, total dual-fuel bills for a typical household increased from £1,175 per year in October 2020 to £1,723 per year in October 2026, a rise of 47%. As the figure below shows, the rise in wholesale costs driven by high gas prices accounts for £444 (81%) of this increase in real terms.
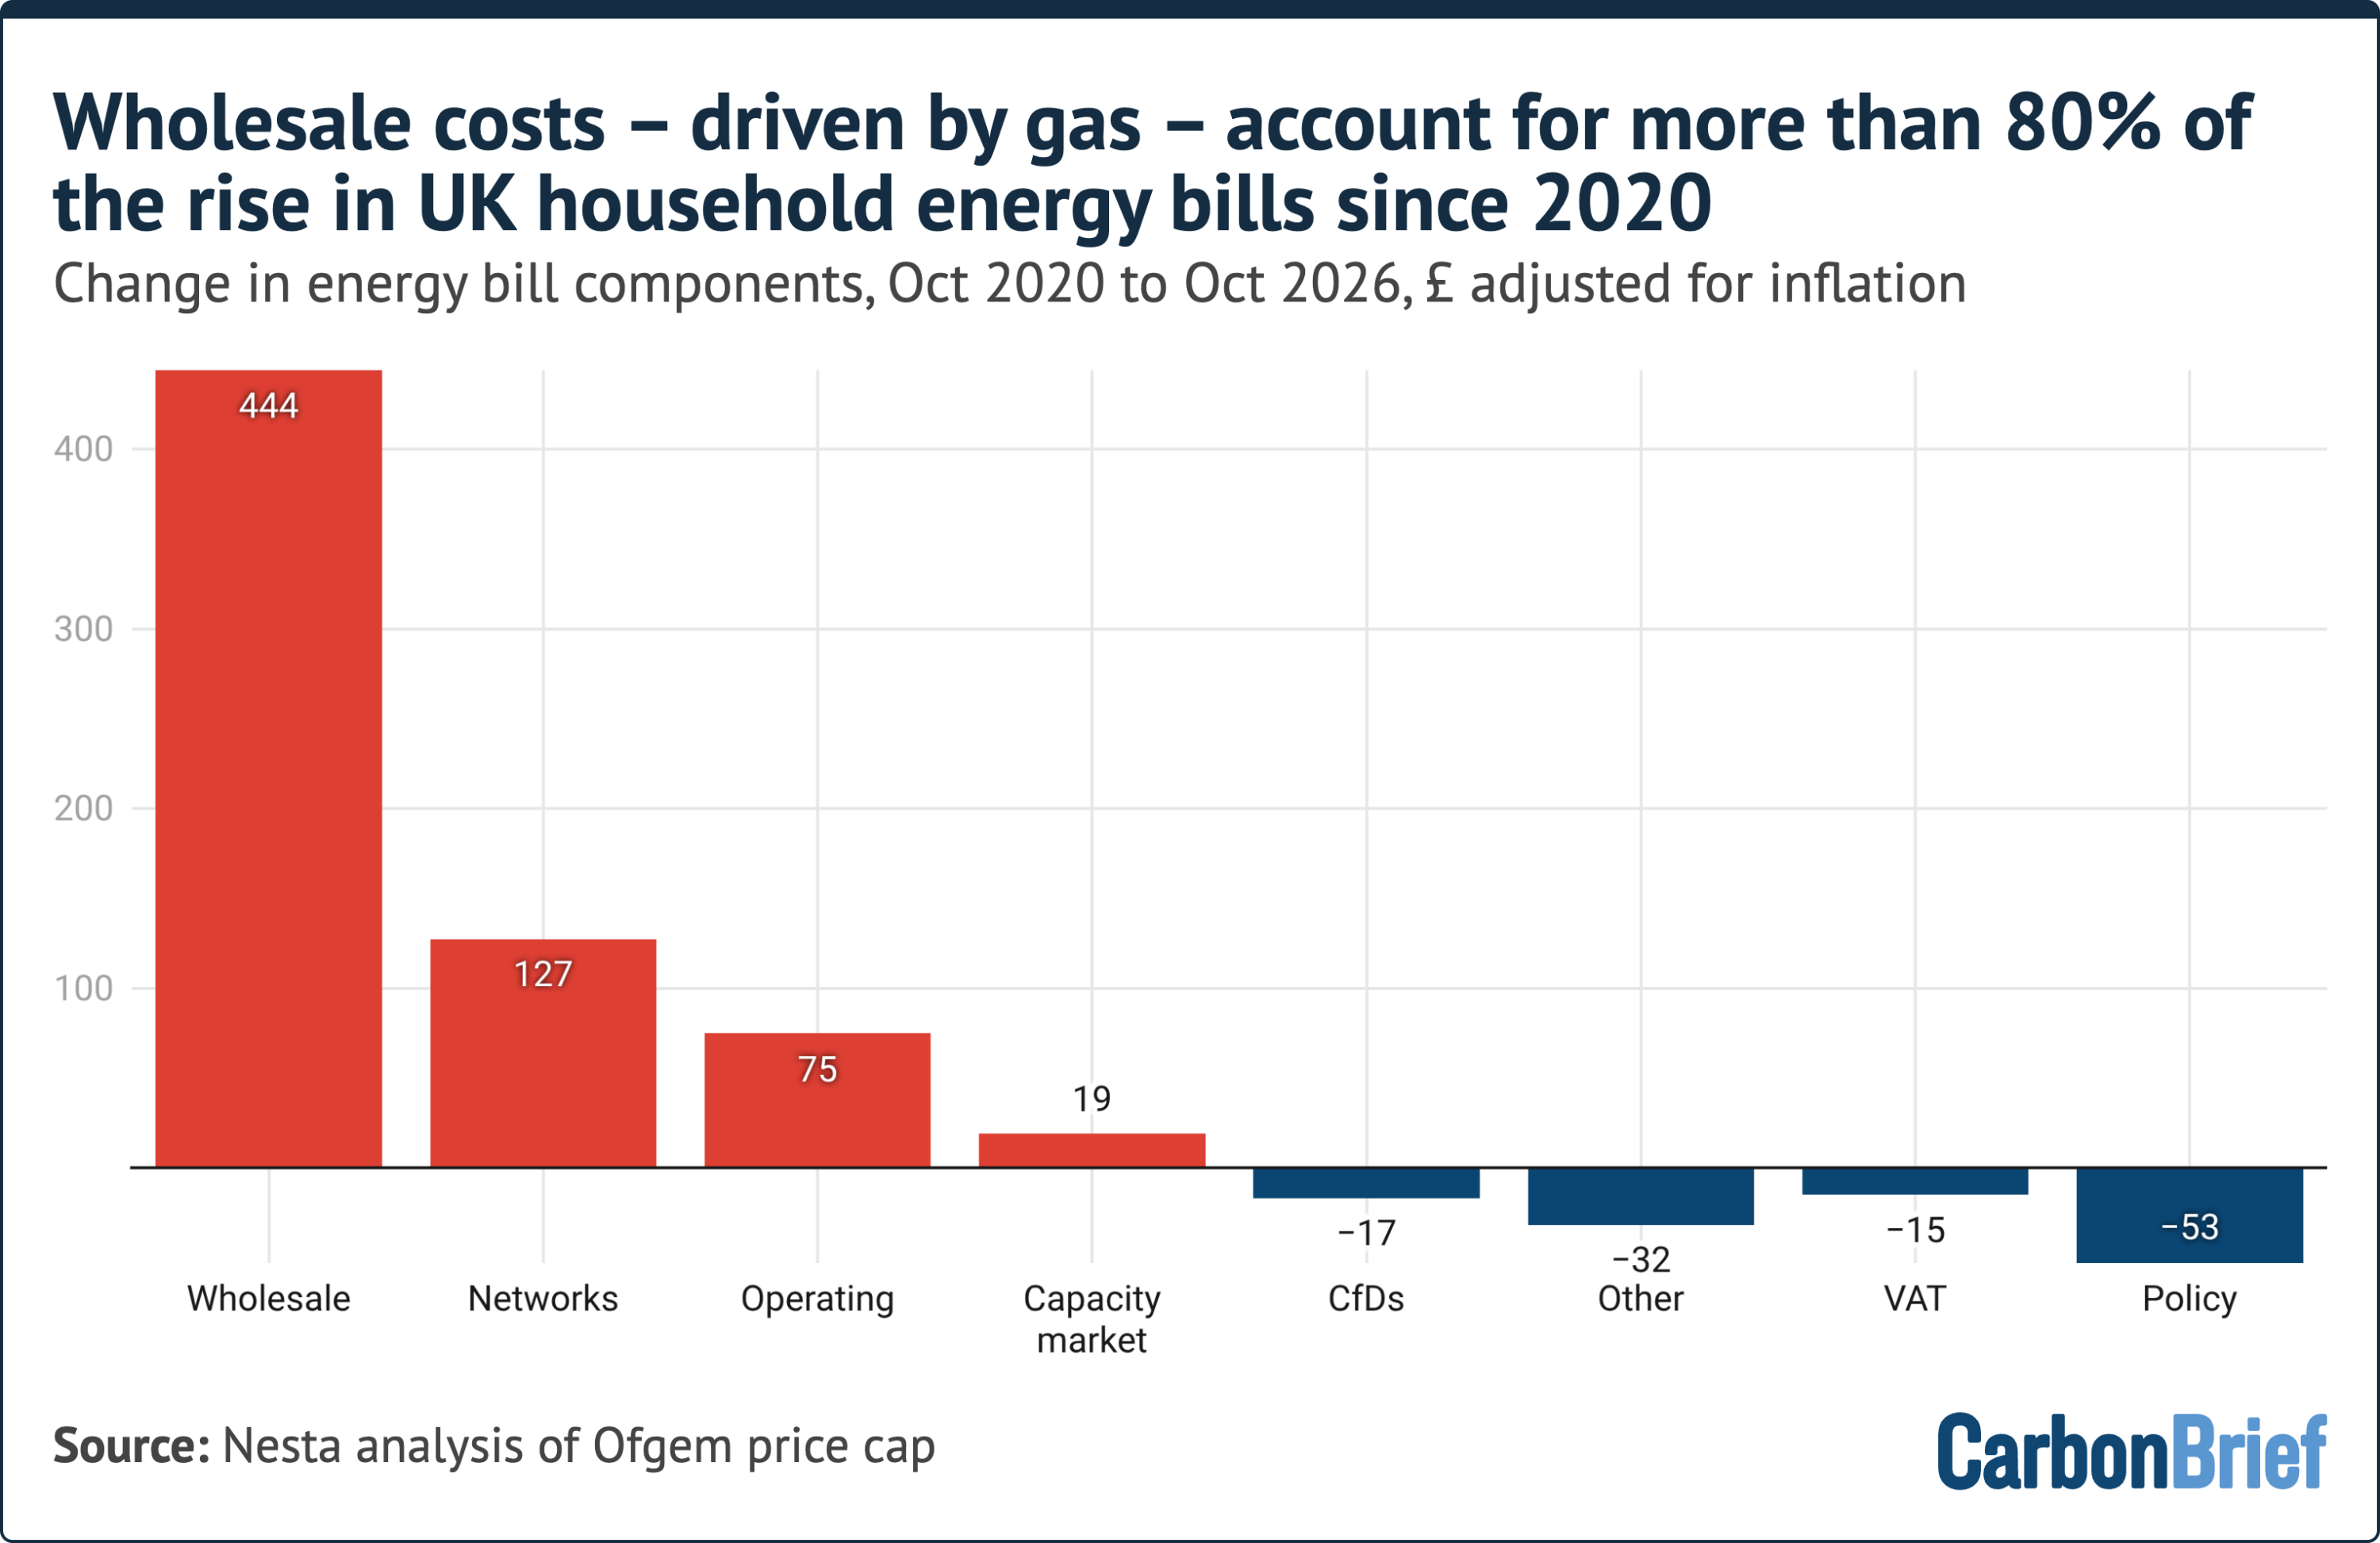
The £127 real-terms rise in network costs includes £72 for electricity transmission, distribution and balancing, plus £55 for investment in the gas grid. The Energy Networks Association says up to 80% of investment in electricity grids is required to maintain existing assets, with the remainder going towards expansion for net-zero.
In total, government social and climate policy costs made up £183 (16%) of typical dual-fuel bills in October 2020, falling to £114 (7%) as of the current October 2026 price cap. Wholesale costs make up the largest share of the current cap at £757 (44%). Network costs are the second-largest component of bills at £417 (24%), followed by operating costs at £291 (17%).
Sissons tells Carbon Brief:
“Upgrading the grid is not cost-neutral, but that price tag is dwarfed by the impact of rising gas prices. In fact, net-zero is helping to shelter Britain from the impact of expensive gas. Since the start of the Iran war, electricity bills have begun to decouple from gas bills, thanks to the UK’s increased renewable power and support from contracts for difference.”
“Going further will require British households to have clean electricity, electric vehicles and heat pumps over fossil-fuel cars and boilers. By focusing on growing electricity demand, the government can spread upgrade costs more widely. This can lock in the consistent investment in electrification that is Britain’s best path to stop global turmoil showing up on winter energy bills.”
What independent sources add
Two other public sources help translate the finding into household planning. UKERC’s Review of Energy Policy 2025 found that £112 of a real-terms electricity-bill increase came from wholesale fuel costs, while network costs added £28 and policy costs added £22. That is not a contradiction of the £180 and 90% figures: it uses a different period, price-cap window and inflation adjustment.
The October 2026 Ofgem price cap for a typical dual-fuel household is £1,723. This helps readers compare their direct debit with the benchmark used in the analysis. In late September 2026, the BBC reported that a typical annual bill was forecast to jump by £276 in January, while market commentary keeps alive the warning that bills could rise by as much as a quarter under the January 2027 price cap.
A December 2025 BBC report on grid investment described a £28bn package that could add £108 to household bills. The practical use is to treat network spending as a real, visible line item while recognising that the current bill story is still dominated by the wholesale gas channel.
What to watch before the next budget
Media reports suggest that, at the upcoming budget on 28 October, the chancellor may take steps to help households and businesses cope with rising energy bills. In light of ongoing high gas prices, bills are expected to rise sharply under the January 2027 price cap, potentially by as much as a quarter.
Common misconceptions to test before sharing
- “Net-zero is making electricity bills rise, so the policy is the main driver.” The master analysis says the opposite: the dominant cost is wholesale gas, while policy costs fell in the dual-fuel calculation.
- “Every network cost increase is a green levy.” The Energy Networks Association says up to 80% of grid investment is maintenance; only part of the electricity network rise goes to balancing, and even constraint payments are small relative to a £858 bill.
- “A fixed tariff makes all wholesale risk disappear.” It can smooth a household budget, but it does not change the market logic that gas often sets the marginal price.
- “Higher supplier operating costs mean supplier greed is the main cause.” Supplier profit is capped at 2.5%, and the analysis points to household energy debt as a possible pressure behind the £46 increase.
Practical checklist for households
- Start with the four parts. Identify wholesale, network, policy and operating costs. If the biggest movement is wholesale, gas is the first suspect.
- Reconcile the cap with your usage. The £1,723 figure is for a typical household, not yours. Update meter readings and compare actual use with the cap assumption.
- Test fix versus variable before January 2027. A fix can protect budget certainty; a variable tariff may follow the cap more directly. The right choice depends on cashflow, risk tolerance and exit terms.
- Watch debt-related line items. If the supplier operating-cost increase is partly linked to household energy debt, early contact about arrears can be more useful than passive switching.
- Read future announcements by cause, not label. If a policy or grid announcement arrives, ask whether it changes wholesale gas exposure, network charges or policy charges.
FAQ: quick answers for non-specialists
Did green taxes drive the rise?
The analysis does not support that conclusion. Policy costs fell from £183 (16%) in October 2020 to £114 (7%) in October 2026, and CfDs were described as reducing bills by £17 under the current cap.
Why are wind farm constraint payments so famous?
They are easy to explain and politically vivid. But the numbers are limited: only £21 of the network-cost rise relates to balancing, and total balancing costs are £35 (4%) of a typical £858 electricity bill.
Should households electrify anyway?
The expert argument is yes, because clean electricity, electric vehicles and heat pumps can spread grid costs and reduce direct gas exposure. The short-term warning is also real: until marginal prices are less tied to gas, global turmoil can still appear on winter energy bills.