
China's 2026 Clean-Tech Export Boom Could Offset a Year of Brazil's CO2: An ItInsightsWorld Explainer
Start with the takeaway, because the headline hides a surprisingly simple mechanism. The climate effect of the solar panels, wind turbines, batteries and electric vehicles that China is shipping abroad this year is no longer marginal: according to a new analysis for Carbon Brief, those 2026 exports are on track to keep roughly 450m tonnes of CO2 (MtCO2) out of the atmosphere in other countries, which amounts to nearly 2% of all emissions outside China. Put another way, one year of Chinese clean-tech trade cancels about what Brazil emits from fossil fuels annually. Below, we unpack how that figure is calculated, why solar does most of the work, who actually captures the benefit, and what a non-specialist reader should do with the information.
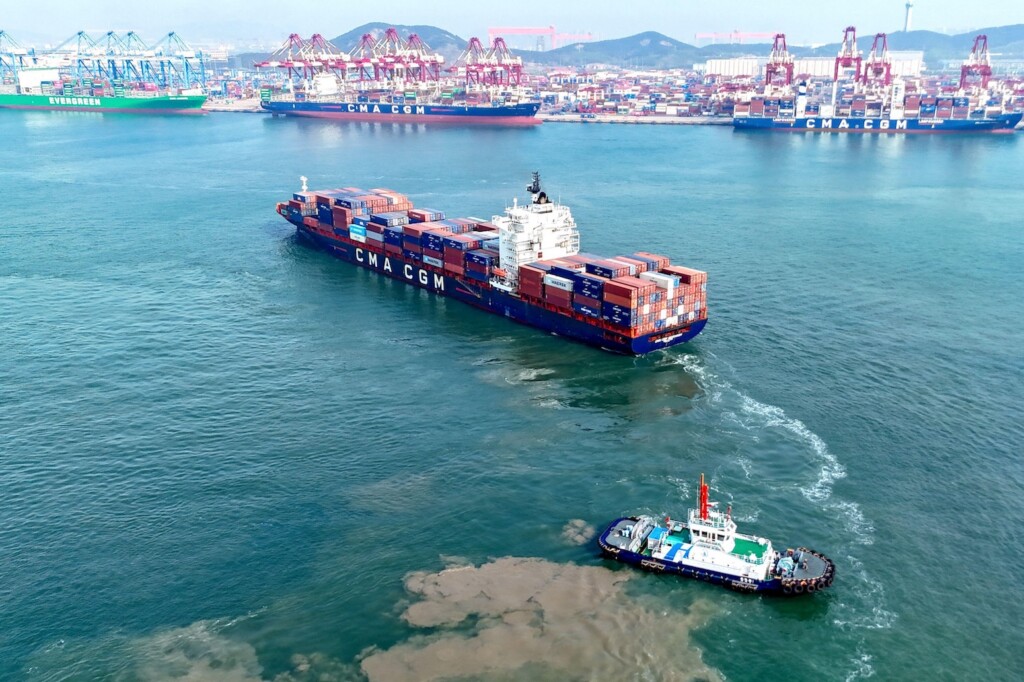
Chinese cargo ship. Credit: Cynthia Lee / Alamy Stock Photo
1. The numbers at a glance
Five data points carry most of the story. Everything else in this explainer is context around them.
- Momentum: the global CO2 impact of these Chinese exports increased by 26% year-on-year in the first three quarters of 2026, after a 36% rise in 2025.
- Annual effect: if recent trends continue through the final quarter of 2026, China's clean-tech exports in 2026 alone would avoid around 450MtCO2 abroad.
- Lifetime effect: across the lifetime of the equipment, exports in 2026 are on track to avoid 8,400MtCO2 — equal to the annual emissions of the US and India combined.
- Trend line: that lifetime total is up by a quarter from 6,800MtCO2 in 2025 and up by two-thirds from 5,000MtCO2 in 2024.
- Baseline for comparison: earlier work showed that clean-energy exports in 2024 would cut emissions in countries outside China by around 1%.
2. How the estimate is built — and what it is not
Readers often ask how a shipment of goods can “avoid” a gas that is never emitted. The method is counterfactual: each exported unit of generating capacity is assumed to displace electricity from the grid of its destination country, and each exported electric vehicle is assumed to displace fuel in an equivalent internal-combustion vehicle. The analysis for Carbon Brief combines detailed clean-tech export data, destination-country electricity systems and emissions from manufacturing in China, so the credit is netted against the carbon cost of building the hardware.
That netting matters. For full-year 2025, manufacturing clean-energy equipment produced emissions of around 170MtCO2 within China, while avoiding 370MtCO2 in other countries. In aggregate, this implies it takes six months for exported goods to pay back the CO2 from manufacturing — a useful rule of thumb whenever someone argues that “making the kit is worse than not making it”.
One caveat before you quote the number: the estimate for the final quarter of 2026 is projected from the year-on-year growth rate in the first three quarters, and CO2 emissions outside China come from Energy Institute data. The result is therefore a well-documented projection, not a completed inventory.
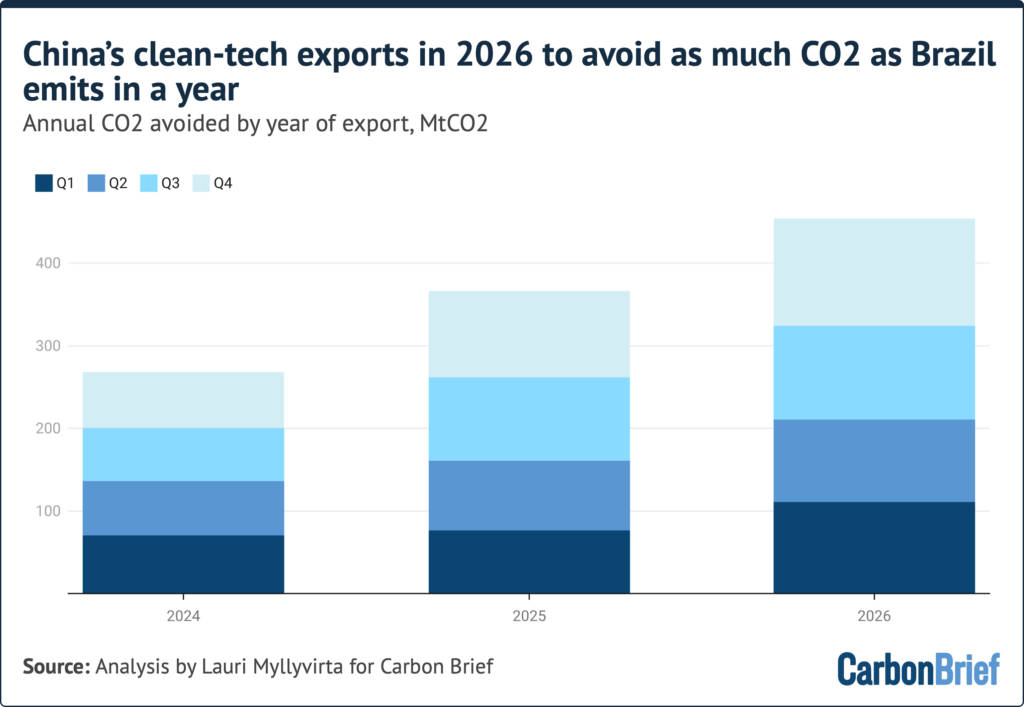
The estimate for the final quarter of 2026 is projected from the year-on-year growth rate in the first three quarters. CO2 emissions outside China from Energy Institute data.
3. Growth scoreboard: which technology is moving fastest
Growth is not evenly spread across the clean-tech basket, and that asymmetry explains where the next bottleneck will sit.
| Export category | Year-on-year growth, first three quarters of 2026 | Reader takeaway |
|---|---|---|
| Electric cars and heavy vehicles | 61% | Fastest riser; transport, not power, is the new frontier |
| Wind turbines | 45% | Small base, steep slope |
| Batteries | 39% | Storage scales with, and after, solar |
| Solar | 22% | Moderate growth on the largest base — still the biggest lever |
| Electric two-wheelers | 21% | Huge unit counts, modest per-unit savings |
4. Why solar does most of the heavy lifting
China's solar-equipment exports remain the largest enabler of decarbonisation in other countries. In full-year data for 2025, China exported finished solar panels and intermediate products corresponding to total generating capacity of 436 gigawatts (GW) once assembled and installed — measured in gigawatts DC, reflecting panel capacity, whereas capacity measured in AC refers to the size of the wire connecting them to the grid.
China also exported 8GW of wind turbines. Together with solar equipment, this will generate approximately 720 terawatt-hours (TWh) of electricity per year, based on average output per unit of capacity for solar and wind in each destination country. For 2026, China's exports of wind and solar equipment are on track to generate approximately 800TWh of electricity, equivalent to generation from around 100 coal-fired power plants.
Over their lifetimes, based on power sources expected to be displaced in each destination country, solar exports in 2025 will avoid an estimated 6,400MtCO2. Solar is therefore by far the largest source of lifetime avoided CO2 emissions. Wind-turbine exports are second, displacing just 180MtCO2.
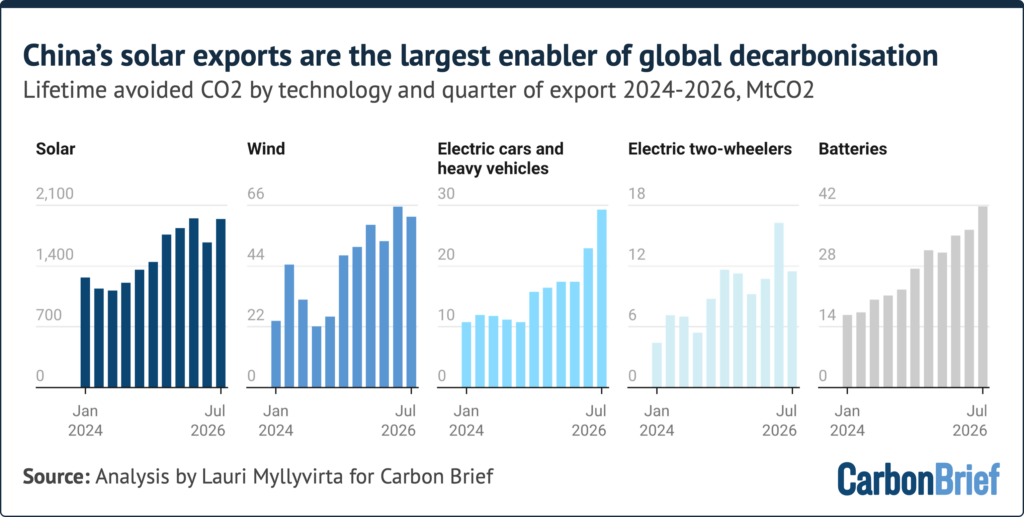
Note the variable y-axes. Avoided emissions are net of manufacturing and assume lifetimes of 20 years for solar and wind, 10 years for cars and batteries or 5 years for two-wheelers.
Vehicles and storage fill in the rest. The 39m electric vehicles exported from China in 2025 included 36m two-wheelers, 2.2m battery electric cars, 160,000 plug-in hybrid cars, 15,000 buses and 30,000 trucks. China also exported batteries with a capacity of 305 gigawatt-hours (GWh) in 2025, enough to power another 5m battery electric cars once installed, based on typical battery sizes. Given typical driving distances, fuel consumption of the vehicles they replace and the CO2 intensity of local grids, EVs and batteries exported in 2025 will avoid an estimated 170MtCO2 over their lifetimes.
The two-wheeler figure deserves special attention because it is the softest number in the set. Given the sheer number of electric two-wheelers, the amount of oil and resulting CO2 they displace is a key uncertainty. Real-world e-bike studies support an assumption that roughly half of e-bike travel displaces use of motor vehicles, either cars or motorbikes depending on location, which suggests China's electric two-wheeler exports in 2025 will avoid an estimated 40MtCO2 over their lifetimes once importing nations' grids are taken into account.
A cost and market lens the analysis does not use
To judge whether this is a structural shift or a temporary price artefact, add two axes that sit outside the original study. The first is hardware cost: trade-price surveys circulated by energy-market outlets report Chinese-made photovoltaic modules changing hands near $0.12 per watt in 2026, against roughly $5-$6 per watt at the turn of the millennium, which makes replacement of existing diesel or coal generation economically rational even without carbon pricing. The second is the size of the total market: the IEA's Global EV Outlook 2026 records global electric car sales passing 20 million in 2025 — about a quarter of new cars — and expects around 23 million in 2026, close to 30% of sales, so China's export volumes are expanding inside a demand curve that is itself steepening. Scale points the same way: IRENA's Renewable capacity statistics 2026 counts 692 GW of new renewable capacity worldwide in 2025, taking the global total to 5,149 GW, with solar alone adding 511 GW. China's 436GW of panel and intermediate exports in a single year therefore sit alongside, not beneath, the world's build-out.
5. Who pays, and who benefits: the split that surprises most readers
Although most clean-tech exports by value went to the global north in the first three quarters of 2026, some 76% of lifetime avoided emissions were in the global south. Within that, 52% of lifetime avoided emissions sit in south and south-east Asia, reflecting solar shipments from China being installed onto high-carbon power grids.
In 2025, some 73% of lifetime emissions avoided by China's clean-tech exports were in global-south countries, which also accounted for 87% of growth year-on-year. In the first three quarters of 2026, global-south countries were responsible for almost all increase in avoided emissions compared with a year earlier.
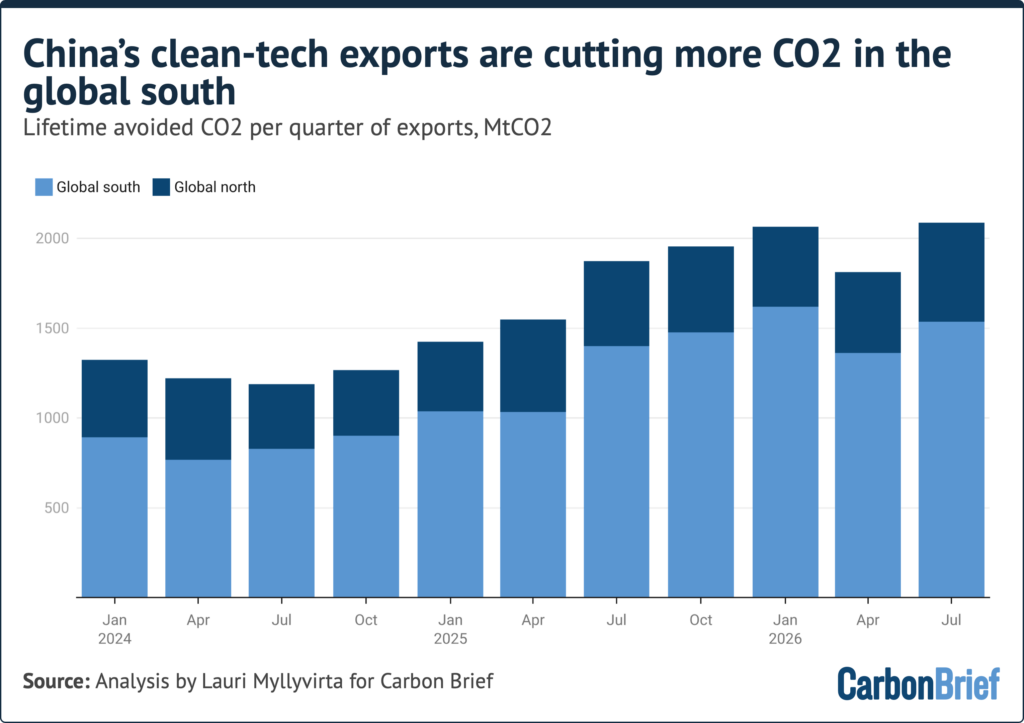
Final destinations for solar exports account for re-export, including post-tariff re-routing to the US via assembly or transit in third countries.
The high share of the global south in avoided emissions reflects large export volumes and power grids that are more carbon-intensive on average, as well as better average solar conditions that result in larger avoided emissions for each gigawatt of solar exported.
6. A world map, not a regional story
At regional level, South Asia has the largest avoided emissions due to imports of Chinese clean-tech, with strong year-on-year growth both in 2025 and the first three quarters of 2026. Other top regional destinations in 2026 to date, in terms of lifetime avoided emissions, include south-east Asia, North America, Europe and the Middle East. Exports span the globe, avoiding billions of tonnes of CO2 across every continent and in nearly every country of the world.
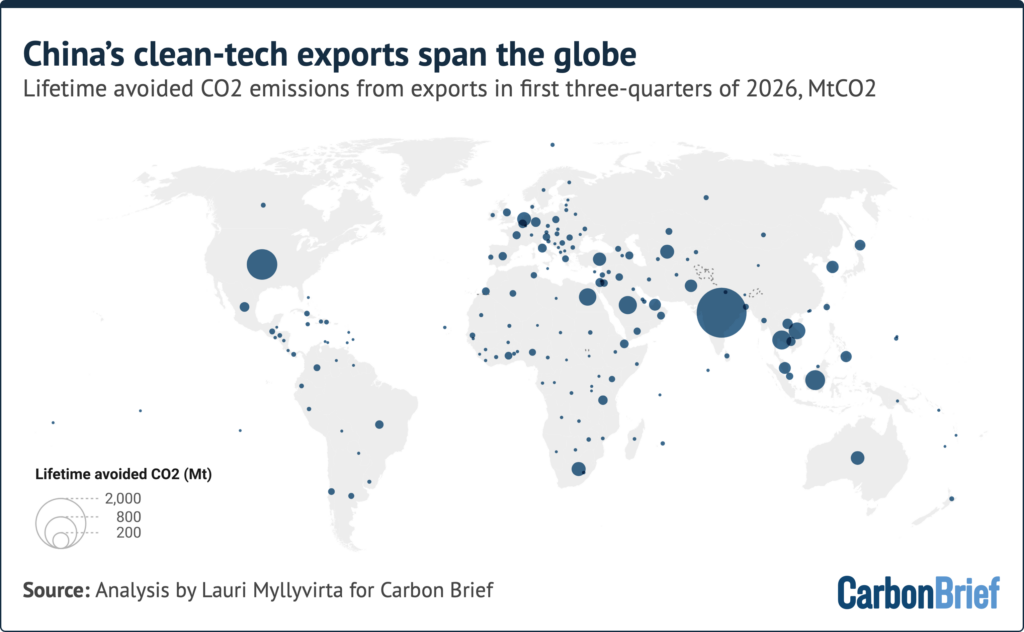
Among countries, the US has the second-largest avoided emissions after India. It registered a further increase of 12% in 2026, despite increased tariffs, and exceeds the EU as a bloc. The US is followed by Thailand, Saudi Arabia, South Africa and Australia. The EU imports more of every clean energy technology than the US, but the US has higher avoided emissions, because average US solar output per unit of capacity is higher — as is the average CO2 intensity of power generation. As a result, every gigawatt of solar installed in the US results in three-times more avoided CO2 emissions than in the EU.
The resilience of Chinese clean-tech exports to the US indicates strong demand for the technology, despite the Trump administration's steps to slow down deployment and discourage imports. The data suggests that reducing reliance on technology supply from China — a policy aim of recent administrations from both parties — is likely to require scaling up of domestic and third-country manufacturing of key technologies, in order to meet that resilient demand.
Not every market moved up. The largest change in national rankings for avoided emissions from clean-tech exports in 2026, compared with previous year, has been a fall in exports to the Gulf countries affected by the war in the region. For electric cars and heavy vehicles, western Europe was the largest destination in the first three quarters of 2026, followed by Latin America and south-east Asia, both of which more than doubled, reflecting the impact of the oil crisis. Exports to the EU gained 39%.
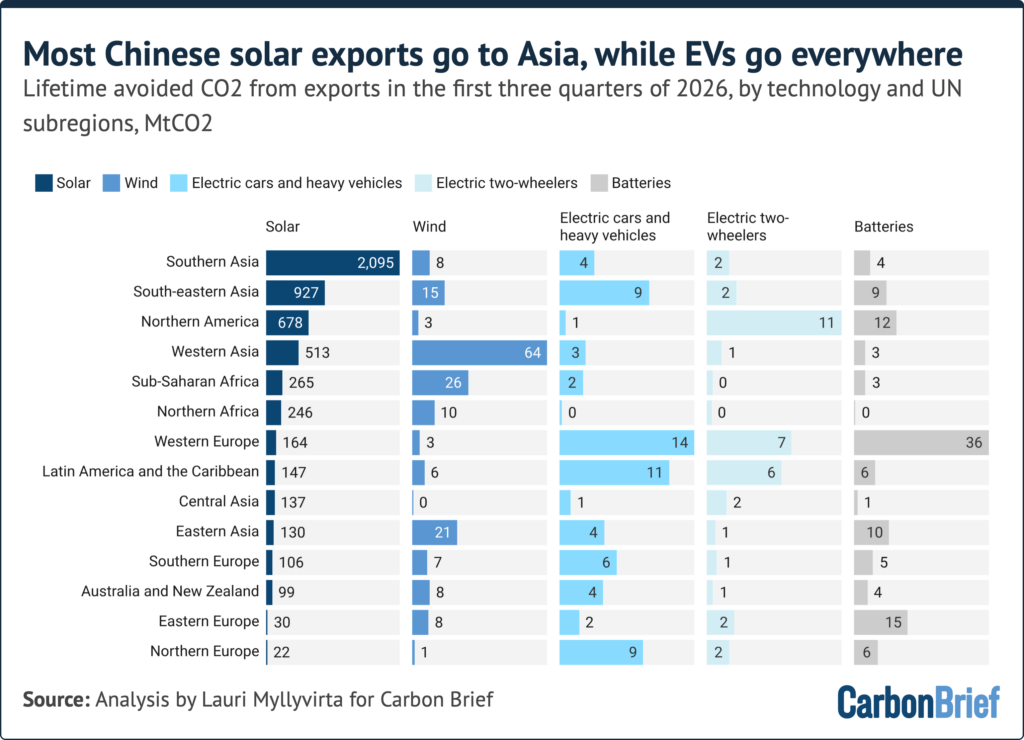
Regional aggregation according to UN subregions, including “western Asia”, which encompasses Turkey, the Caucasus and the Middle East. Final destinations for solar exports account for re-export, including post-tariff re-routing to the US via assembly or transit in third countries.
When including batteries and electric two-wheelers, North America and Europe are largest destinations for avoided emissions due to EV-related exports, followed by Latin America and south-east Asia. Exports of Chinese solar equipment to the US rose 13% year-on-year in the first three quarters of 2026, once re-routing through different channels is considered — a reversal of the dip early in the year, due to a sharp increase in tariffs in June 2025. Exports of EVs and batteries to the US also increased slightly, by 3% in the first three quarters of 2026.
One reading trap to avoid: recorded “buyer” countries are not always where the hardware ends up. Trade reporting consistently places the Netherlands among the top European inbound markets for Chinese modules and inverters, largely because it functions as a regional distribution hub for onward flows rather than as the final installation site. Treat hub-like entries as routing, not as demand.
7. The second channel: projects China builds, not just sells
Alongside clean-tech exports, China is increasingly involved directly in developing overseas clean-energy projects. This traces back to the 2021 pledge by Chinese president Xi Jinping, in which he said:
“China will step up support for other developing countries in developing green and low-carbon energy, and will not build new coal-fired power projects abroad.”
As of July 2026, some 69GW of China-linked renewable energy projects were in operation overseas, with an additional 100GW being built and 280GW in planning but not yet under construction. This renewable energy capacity is supported by 3.5GW of China-linked energy storage projects in operation, with a further 21.4GW of storage in the pipeline.
Nuclear is a smaller but strategic layer: China has financed and built six operating nuclear reactors overseas, with total capacity of 3.3GW, all located in Pakistan, and in 2023 they had total generation of 26TWh. China began construction on the 1.2GW Chashma-5 reactor in 2024, also in Pakistan, with the plant expected to be operational around 2030.
Velocity is the real headline. The expected electricity output of China's newly operating overseas clean-power projects doubled from 2022 to 2025, with a further 6% year-on-year increase in the first seven months of 2026, and China-owned clean-energy projects built in other countries doubled over 2022-25. The countries with largest estimated generation from China-linked clean-power capacity are Indonesia, Vietnam, Bangladesh, Mongolia, Zimbabwe, Laos, Turkey and South Africa. When operating, under-construction and planned capacity are combined, Saudi Arabia, Uzbekistan, Indonesia and Pakistan are expected to see the largest avoided CO2.
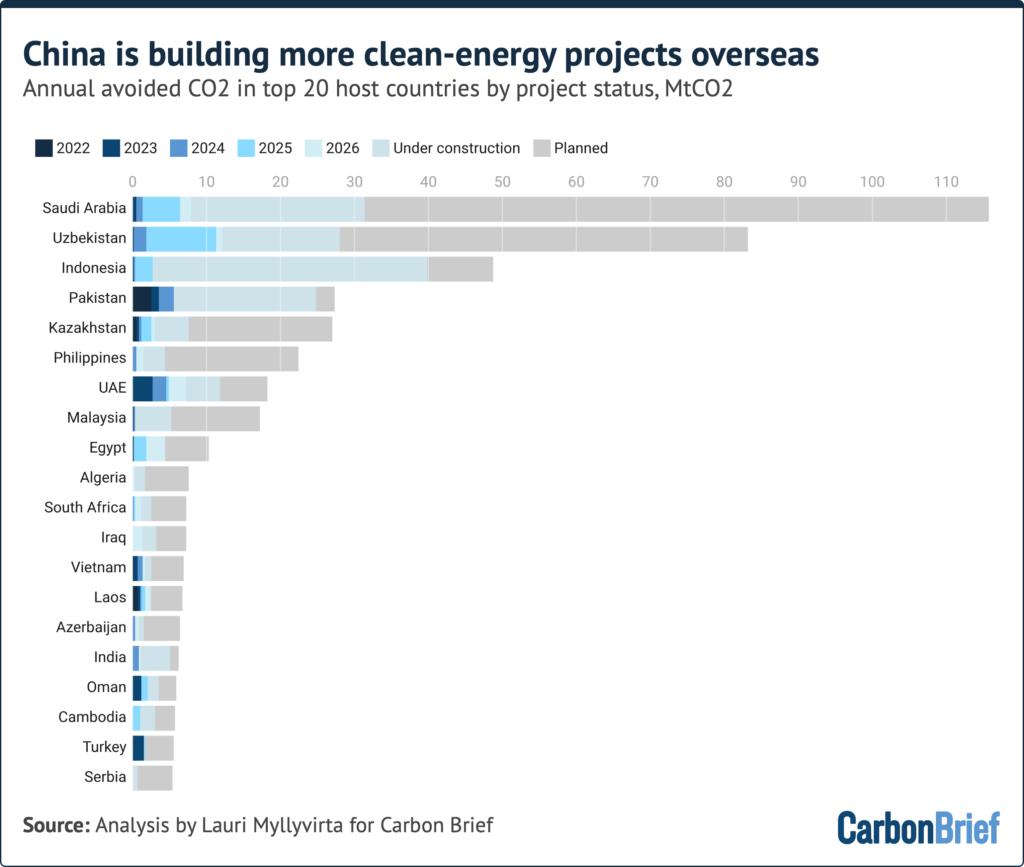
Based on renewable project data from DCore, nuclear data from World Nuclear Association and grid CO2 intensity data from Ember.
The shift has redefined China's role in power-sector development of other emerging countries. Having previously been the main financier of coal-power projects, it is now an important force in developing clean-power generation. Nevertheless, there are gaps in implementation of Xi's pledge to end overseas coal-power development, which could be seen to affect its effectiveness and credibility — particularly with respect to “captive” coal-power plants linked to industrial projects in Indonesia.
Scale check, and it is the one most coverage skips: in 2025, some 8.4GW of solar-power projects with Chinese financing or involvement entered operation and 18GW were newly announced, while in the same year China exported 436GW of solar panels and intermediates. Financing, project development and construction using Chinese clean-tech is therefore overwhelmingly carried out by local and other non-Chinese actors.
8. Does this crowd out everyone else?
A key concern in countries around the world is that Chinese industrial “overcapacity” is crowding out domestic industries, from automotive to steel or chemicals. The export data tells a more complicated story.
Analysis of China's clean-tech exports suggests they have generally been additional, meaning they have not displaced exports by other producers — a sign that China's exports have either captured or enabled market growth. Value of EV exports from other countries has grown much more than those from China, led by the EU27 — particularly Germany — as well as Mexico, Japan, the UK and South Korea. Similarly, there has been growth in value of exports of heat pumps, solar inverters and electrolysers from both China and other countries.
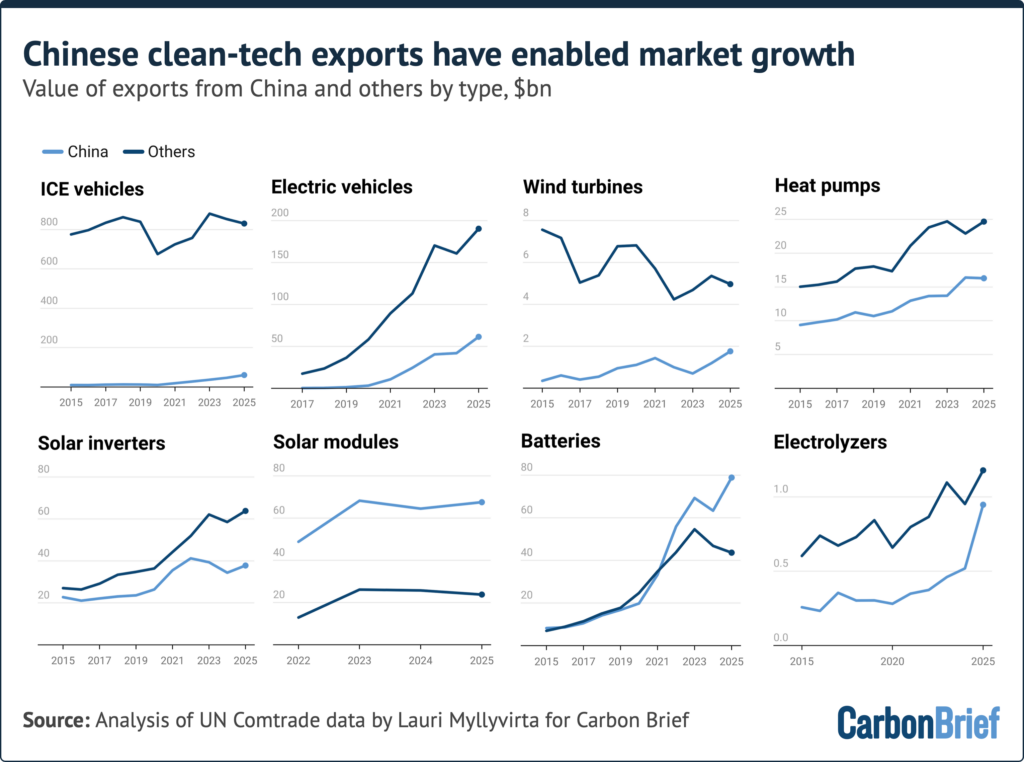
Three exceptions are worth remembering.
- Wind is the genuine displacement case. China's exports have grown while exports by other producers have declined, representing displacement at global level. On the level of importing countries, however, there has not been displacement: China's wind-turbine exports have mostly headed to countries with growing markets, while incumbent producers have seen declines in some of their previously important markets.
- Policy can push the other way. Tariffs and restrictions on use of Chinese components have seen other producers expanding into existing markets for solar panels, solar inverters and heat pumps, while China's exports of those technologies have been redirected into new markets that previously imported little solar equipment.
- Segmentation hides behind the averages. For EVs, solar inverters and heat pumps, Chinese exports carry much lower unit prices than equivalent exports from other producers — and there has been much clearer displacement in the case of fuel-burning vehicles, where low-cost products from China have replaced exports from other suppliers.
9. Why China has skin in the game — and the wrinkle to watch
Clean-energy technology has become a cornerstone of China's economy, responsible for 16% of all net growth in total exports in the first half of 2026, although the share fell in the third quarter due to a broad surge in exports, even as cleantech growth accelerated as well. More broadly, clean energy sectors contributed a third of China's GDP growth in 2025, which means the country has clear economic self-interest in the success of the global energy transition.
That interest could shape diplomacy. China's role as major supplier of electrification technologies could give it a reason to support a push by the COP31 presidency for a global electrification target — a proposal, published through the UN climate process, to raise the share of final energy demand met by electricity from just over 20% today to 35% by 2035. It is the first time such a number has been tabled as a summit goal, which reframes clean-tech trade as policy infrastructure rather than ordinary commodity flow.
The wrinkle is at home. Clean-energy sales within China are larger than exports for most technologies: only 43% of solar cells and panels, 13% of EVs, 17% of batteries and 7% of wind turbines produced in China were exported in 2025, highlighting the importance of the home market for producers. EV and wind deployment has continued to grow domestically, but for solar and battery energy storage the domestic market has dived after record volumes in 2025. For solar, exports continue to expand and could outweigh China's domestic deployment after a slowdown in the sector in 2026 — which could exacerbate overseas concerns about “unfair” trade practices, unless the domestic market picks up again.
10. Four misconceptions this story keeps generating
- “Avoided emissions are free carbon credits.” They are modelled counterfactuals, netted against manufacturing, and they depend on the grid each panel or vehicle lands on.
- “These exports mostly serve rich buyers.” Value concentrates in the global north; three-quarters of the lifetime climate benefit accrues in the global south.
- “Chinese gear is simply wiping out foreign rivals.” Only wind shows clear global displacement; EVs, heat pumps and solar components have grown for other producers too.
- “Overseas power plants are the main lever.” China-linked projects abroad doubled from 2022-25, but the CO2 avoided remains small compared with equipment exports.
11. What to watch next: a practical checklist
You do not need to be an energy analyst to use this. Five monitoring habits turn the same numbers into decisions.
- Follow the fourth-quarter trade data. The 450MtCO2 headline is a projection from growth in the first three quarters of 2026, so a Q4 stall would change the conclusion, not just the decimal.
- Watch China's domestic solar market. A sustained slowdown pushes more capacity into exports and raises the odds of tariff and subsidy disputes elsewhere.
- Judge any import claim by grid intensity, not volume. A gigawatt installed on a coal-heavy grid in south and south-east Asia avoids far more CO2 than the same gigawatt in a low-carbon system.
- Treat “de-risking” pledges as capacity questions. Meeting resilient demand without Chinese supply means building factories at home or in third countries — watch for plant announcements, not press releases.
- Compare hardware prices with policy targets. If module prices stay near $0.12 per watt, a 35% electrification ambition looks like a procurement problem rather than a technology problem.
FAQ: quick answers for busy readers
Is the Brazil comparison literal?
It is a benchmark, not an accounting identity. The analysis states that 2026 exports would avoid around 450m tonnes of CO2 abroad, roughly Brazil's annual emissions; national-emissions datasets place Brazil's fossil CO2 total somewhat higher in recent years, so read the claim as “about one Brazil-year” rather than an exact offset.
Why do imports keep rising in countries that raised tariffs?
Because demand is price- and availability-driven, and shipments can be re-routed. Exports of Chinese solar equipment to the US rose 13% year-on-year in the first three quarters of 2026 once re-routing through different channels is considered, after the tariff jump in June 2025.
Does manufacturing in China cancel the benefit?
No, but it must be counted. Manufacturing produced around 170MtCO2 in China in 2025 while avoiding 370MtCO2 abroad, which works out to a payback period of six months.
Where can I check the underlying data myself?
The primary write-up is the Carbon Brief analysis at carbonbrief.org, and the export series behind it is published free of charge by Ember at ember-energy.org; global capacity and EV baselines come from irena.org and iea.org respectively.
Sources and method notes
Export volumes: solar exports include finished modules as well as intermediates (wafers and cells), each expressed by Ember as finished-panel-equivalent gigawatts, with data taken from Ember's China solar exports tracker. Wind and battery export totals come from Chinese industry bodies, the China Wind Energy Association (CWEA) and the China Automotive Battery Innovation Alliance (CABIA), distributed across destination countries and months using customs-value shares from Ember's China clean-tech exports tracker. Electric-vehicle volumes use vehicle counts from China Customs. Exports to Hong Kong are excluded and replaced with Hong Kong's onward re-exports, treated as Chinese exports. Regional groupings follow UN subregions.
Additional references used in this explainer: the Carbon Brief analysis on China's clean-tech exports in 2026; IRENA, Renewable capacity statistics 2026 (irena.org); IEA, Global EV Outlook 2026 (iea.org); the COP31 presidency electrification proposal (unfccc.int); Brazil emissions profiles compiled by Our World in Data (ourworldindata.org); and 2026 module price reporting summarised by oilprice.com.
Written by James Hartley for the ItInsightsWorld General desk. Corrections and editorial contact: contact@itinsights.com.
Clean-tech trade has quietly become one of the largest single levers in the global emissions equation — and, unlike most climate commitments, it is being executed by procurement decisions rather than by treaty. The honest conclusion for readers is not that one country is saving the planet, but that hardware availability now sets the pace of decarbonisation everywhere else. Read next quarter's shipping numbers before you read the next summit communiqué.