
2026 or 2024? A Practical Guide to Reading the Hottest-Year Race Before January 2027
Bottom line first. Three of four quarters are already banked, and the contest for the warmest year since systematic measurement began has narrowed to two candidates. No office on earth can honestly name a winner today — but the odds, the mechanism and the remaining uncertainty are now clear enough to act on. This guide is written for readers who want to use that information rather than argue about it: what the numbers actually say, why agencies disagree, how timing shifts the decisive evidence into next year, the traps to avoid when a headline lands, and what to do over the coming ninety days. The underlying evidence is Carbon Brief’s latest “state of the climate” quarterly assessment, republished here as decision support for a general audience by James Hartley of IT Insights.

Livestock sheltering from the sun under the shade of trees in Spain. Photo credit: Marcin Drabik / Alamy Stock Photo.
Five takeaways worth memorising
Grab the conclusions now; the reasoning follows step by step.
- The month-by-month part is already settled. August 2026 finished as the warmest August ever measured in all six datasets that track global surface temperature, roughly 0.12C above the previous best. September was the second-warmest September on record, still about 0.08C behind September 2023.
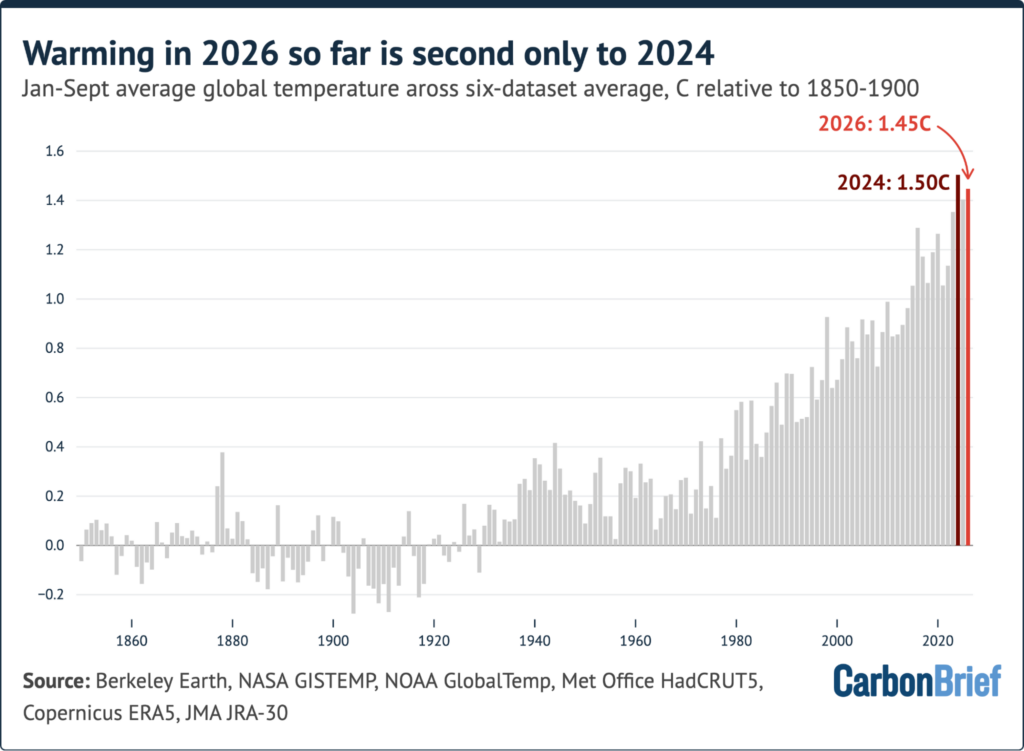
- The running total sits second, by a whisker. January-September came in near 1.45C above the 1850-1900 pre-industrial baseline, trailing only 2024 by around 0.06C.
- The coin-flip is a 67% coin-flip. Averaging the six datasets, Carbon Brief gives this year a 67% chance of overtaking 2024. Read dataset by dataset, the same question produces answers ranging from 97% down to under 20%.
- The Pacific driver is off the historical chart. The daily Niño3.4 anomaly in the tropical Pacific broke the record set in November 2015 and has stayed above it every day since; 656 forecasts from 14 dynamical models point to a peak close to 4C this winter.
- The bigger signal lands next year. 2027 is projected near 1.7C above pre-industrial levels, carrying a 96% probability of being the warmest year ever measured.
One further figure separates weather noise from physics. Earth’s energy imbalance — sunlight absorbed minus heat radiated back to space — has more than doubled since the CERES satellite record opened in March 2000, moving from roughly 0.5 watts per metre squared (W/m2) in the 2000s to about 1.25W/m2 over the past decade. El Niño brings stored ocean heat up into the atmosphere; it does not manufacture that heat.
Step 1: Check whose thermometer you are quoting
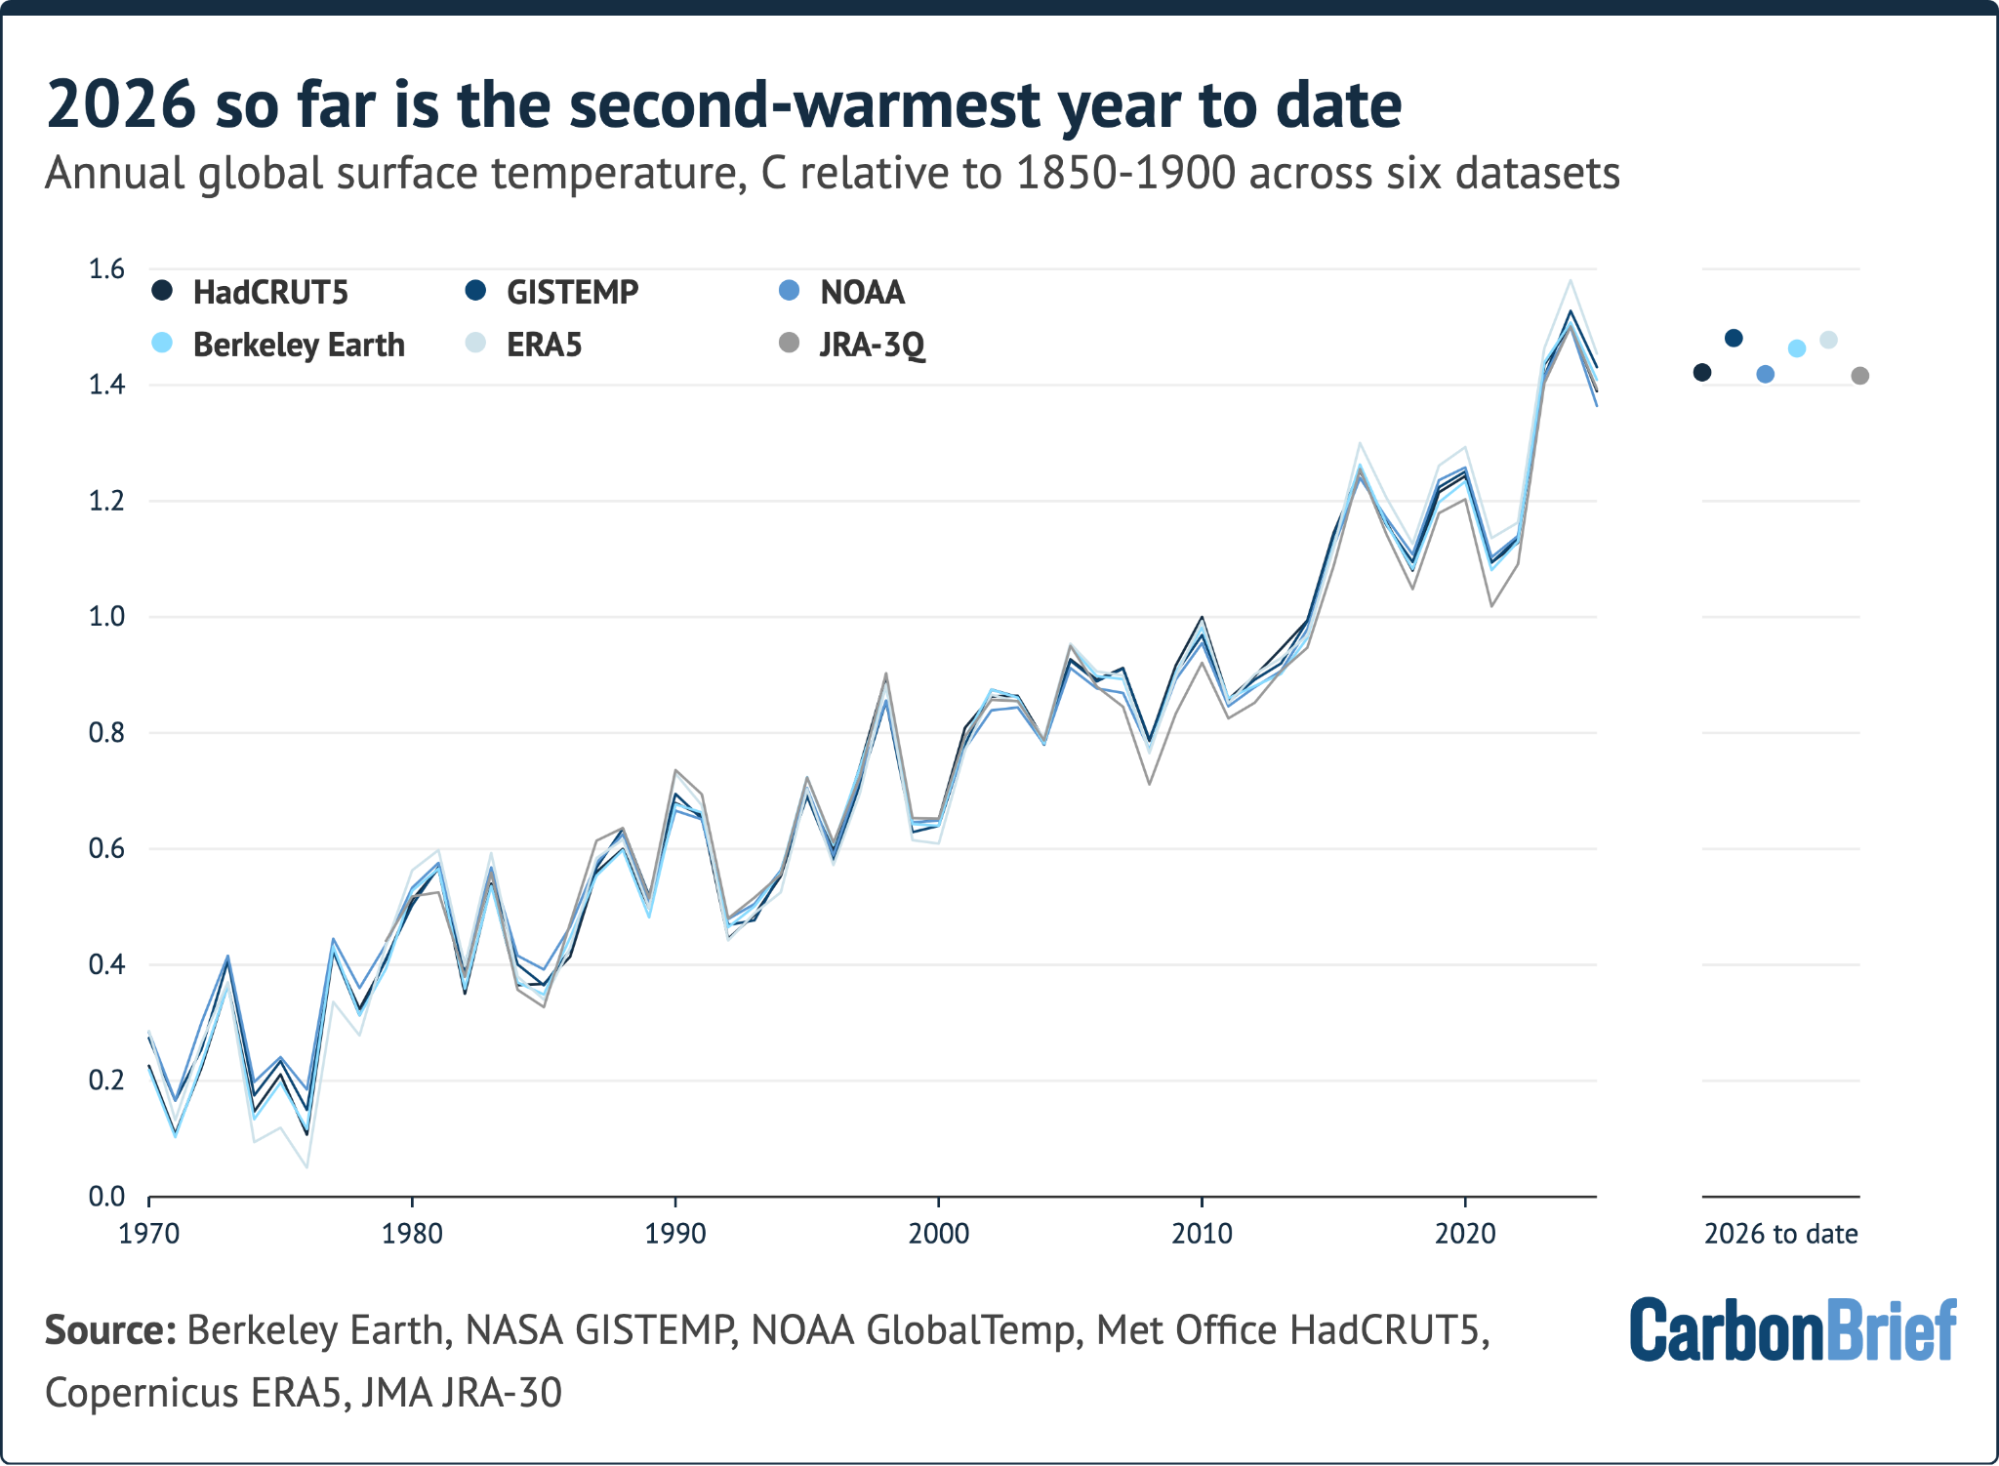
Here is the trap that catches most readers: “global temperature” is not a single number produced by a single agency. It is six independent estimates, each with its own sea-surface inputs, its own strategy for filling regions where few observations exist — the Arctic and Antarctic especially — and its own reference period. Carbon Brief lines the series up on a shared 1981-2010 baseline, then shifts them by the 0.67C of warming recorded between 1850-1900 and 1981-2010 so they can sit on one chart. The groups behind the six series are NASA’s GISTEMP, NOAAGlobalTemp from NOAA, HadCRUT5 from the Met Office Hadley Centre and University of East Anglia, Berkeley Earth, Copernicus/ECMWF’s ERA5 reanalysis product, and JRA-3Q from the Japan Meteorological Agency. Other groups appear in the annual “state of the climate” update but are left out here because they do not publish monthly figures.
| Dataset | Who produces it | How the map gets completed | Odds of naming 2026 a record |
|---|---|---|---|
| Berkeley Earth | Berkeley Earth (independent research group) | Aggressive statistical interpolation, so poorly covered regions are filled generously | Very likely — 97% |
| NASA GISTEMP | NASA’s Goddard Institute for Space Studies | Each grid box is infilled from measurements up to 1,200 km away, per NASA’s published GISTEMP methodology | Likely — 82% |
| HadCRUT5 | Met Office Hadley Centre with University of East Anglia | Deliberately sparse treatment of under-observed areas | 72% so far — based on July-August data only; a plausible 50% to 80% once September lands |
| JRA-3Q | Japan Meteorological Agency | Reanalysis: a weather model constrained by observations estimates air temperature everywhere | 48% — about as likely as not |
| NOAAGlobalTemp | NOAA | Land stations blended with sea-surface temperature records | 34% — also too close to call |
| ERA5 | Copernicus/ECMWF | Reanalysis, same model-constrained approach as JRA-3Q | Unlikely — 18%, under 20% |
None of these products is “right” in some absolute sense. They answer slightly different questions about a planet with uneven instruments. That distinction alone defuses most of the online arguing you will see in January.
The chart below plots annual values in each dataset since 1970 together with the 2026 average to date; the 2026 markers are staggered horizontally so they do not overlap, and the HadCRUT5 point covers January-August because September had not been published when the analysis was finalised.
Step 2: Read the year as a calendar, not a headline
The pace of 2026 changed mid-year, and the order of events matters for prediction.
- Slow start. Every month from January to June came in cooler than the same month in 2024, as the fading influence of weak La Niña conditions gave way to a developing El Niño. La Niña and El Niño are the cool and warm phases of the El Niño-Southern Oscillation (ENSO), the recurring tropical Pacific pattern that reroutes weather around the world.
- July turned the corner. July 2026 was the second-warmest July in the six-dataset average and a narrow record in NASA GISTEMP and NOAA; NOAA’s own assessment had it level with July 2024.
- August broke its own month. A new record by roughly 0.12C in the average, confirmed as the warmest August in every dataset, with margins from 0.07C (HadCRUT5 and NOAA) to 0.13C (ERA5).
- September paused. Around 1.62C, second-warmest on record in the five datasets that had reported by publication.
- Quarter view. July-September 2026 effectively tied the same quarter of 2023 as the warmest measured, near 1.57C — first in GISTEMP and NOAA (and in HadCRUT5 for July-August), second in Berkeley Earth, ERA5 and JRA-3Q.
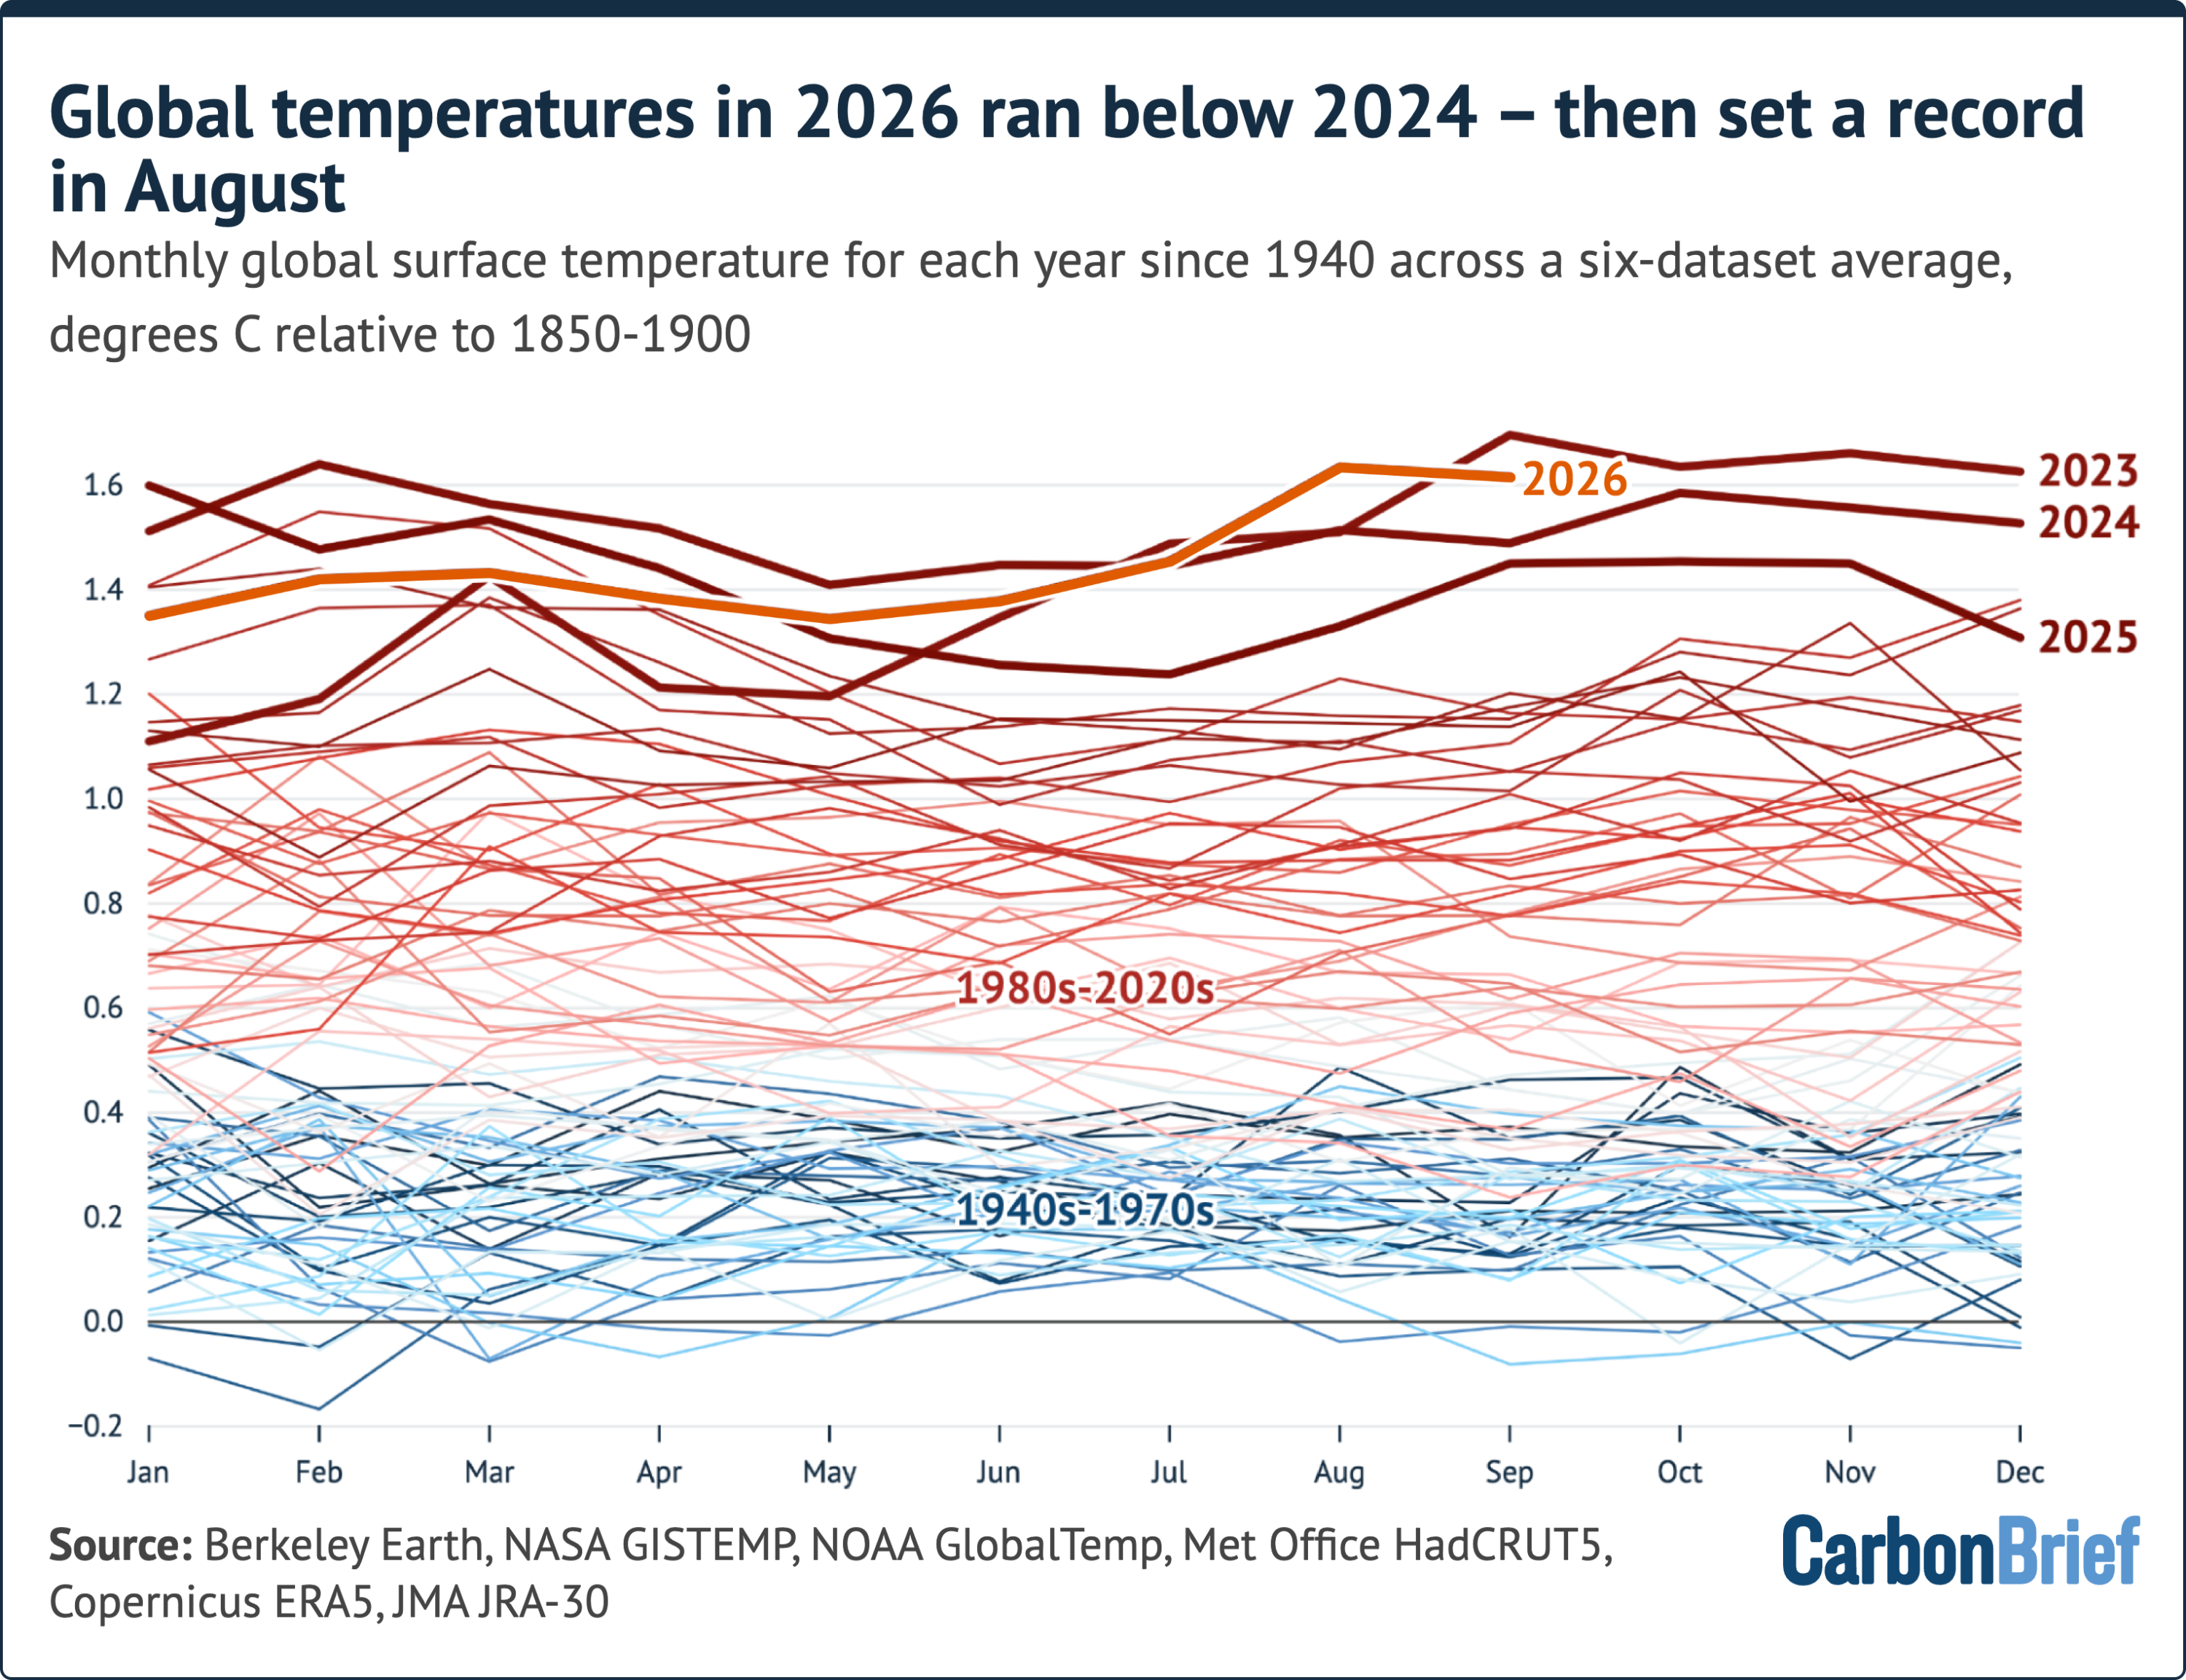
Monthly averages of six global mean surface temperature datasets; the September marker excludes HadCRUT5, which had not yet reported.
Plotting the January-September average for every year back to 1850 makes the remaining task concrete: 2026 sits at 1.45C, about 0.06C below the equivalent figure for 2024.
Step 3: Learn the three-month lag rule
If you remember one mechanism from this article, make it this one: global air temperatures tend to lag the tropical Pacific by about three months. An El Niño that peaks at the end of 2026 therefore delivers its largest global-temperature effect during 2027. The precedent is exact — the 2015-16 event helped make 2016 the then-warmest year on record.
The event itself is now exceptional. In September, daily sea-surface temperature in the Niño3.4 region — the box most widely used to rate El Niño strength — exceeded the anomaly last set in November 2015, making this the strongest event since the satellite era began in 1981 and the highest monthly anomaly for that box since records reach back to the mid-1800s. As of 18 October the daily value sat around 3.5C above the 1996-2025 average for that time of year, roughly 0.4C above the 2015 peak.
Two useful calibrations for anyone checking official bulletins. First, NOAA’s Climate Prediction classifies an El Niño only when monthly Niño3.4 departures reach +0.5C or more, atmospheric conditions line up with it, and the pattern is forecast to persist for three consecutive months — so “El Niño conditions” in a bulletin is a formal label, not a casual description (see the CPC ENSO pages at cpc.ncep.noaa.gov). Second, what you see reported as “the” anomaly depends on the base period: Carbon Brief expresses Niño3.4 against a rolling 1996-2025 climatology, while agencies often publish against fixed 30-year normals. Same ocean, different yardstick.
On the outlook, Carbon Brief pooled 656 forecasts from 14 climate models run between late September and mid-October. Their average has the event peaking near 4C in December, more than 1C above the previous record; ten models favour a December peak and four expect November. That is a strengthening of expectations from July’s “state of the climate” round, when the working number was about 3.6C. Analysis of tree rings and coral sediments suggests this may be the strongest El Niño in a thousand years.
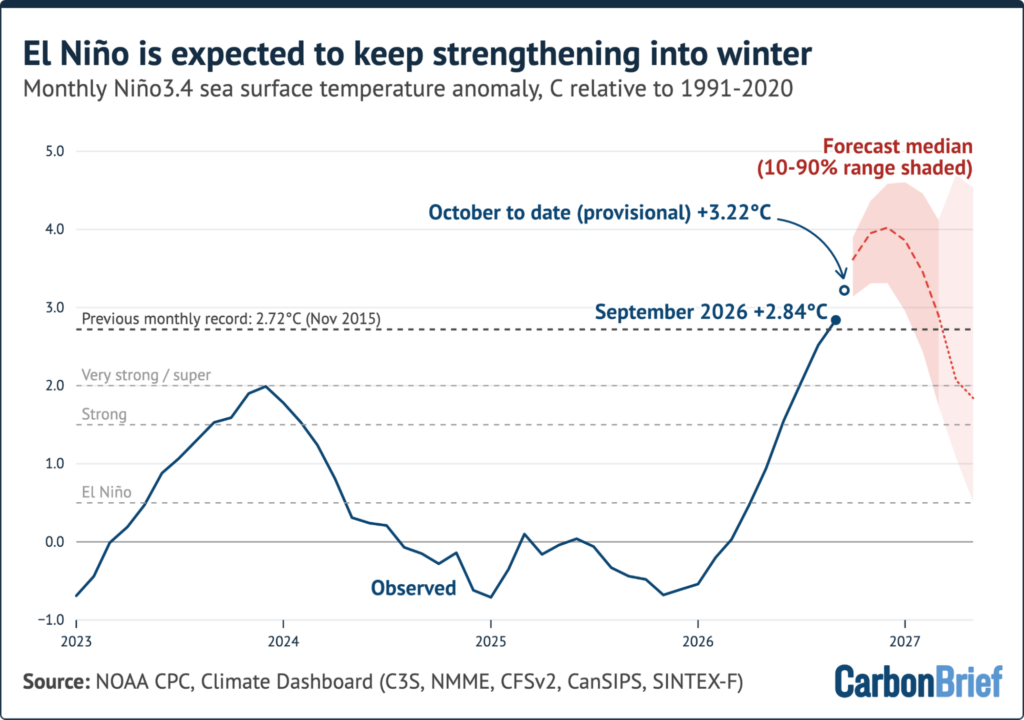
Mean of 656 forecasts from 14 dynamical models; the lighter shading marks the window in which only seven models were available.
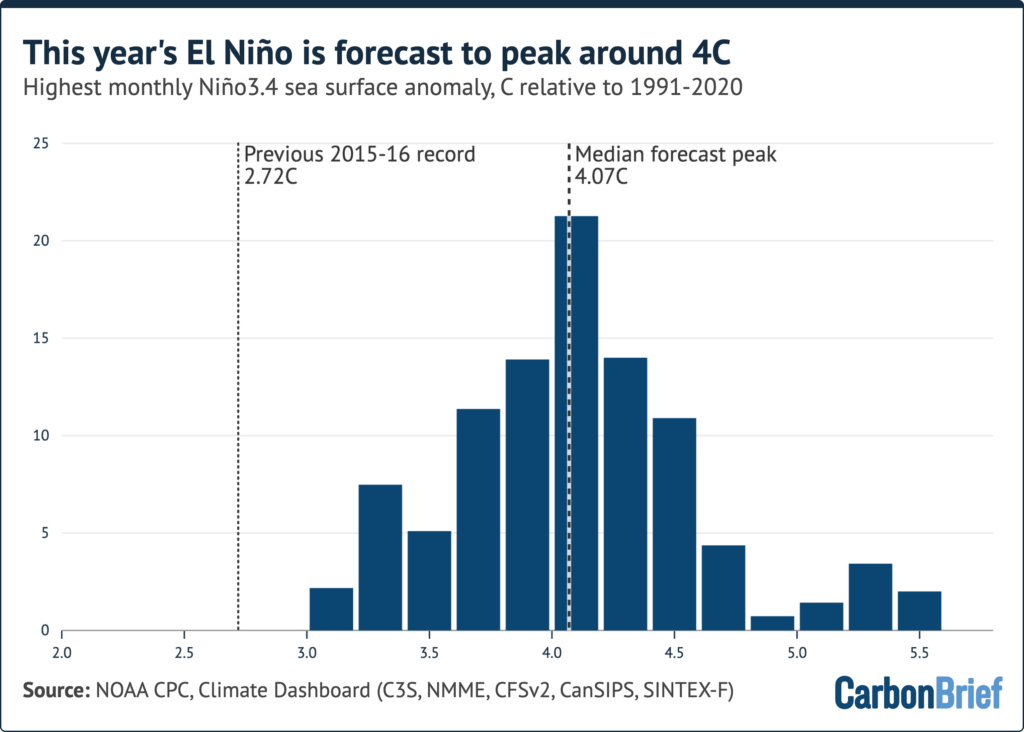
Projected peak warming of the Niño3.4 region across 656 runs of 14 dynamical El Niño models. The vertical axis gives the share of runs falling in each 0.2C “bin”.
None of this displaces the underlying cause. Human emissions of CO2 and other greenhouse gases account for effectively all long-term warming; El Niño and La Niña decide how that warming is arranged in any individual year.
Step 4: See where the record heat actually fell
Averages hide geography. In the ERA5 reanalysis, July-September 2026 came out 0.96C above the 1981-2010 average and 1.58C above ERA5’s 1850-1900 pre-industrial reference.
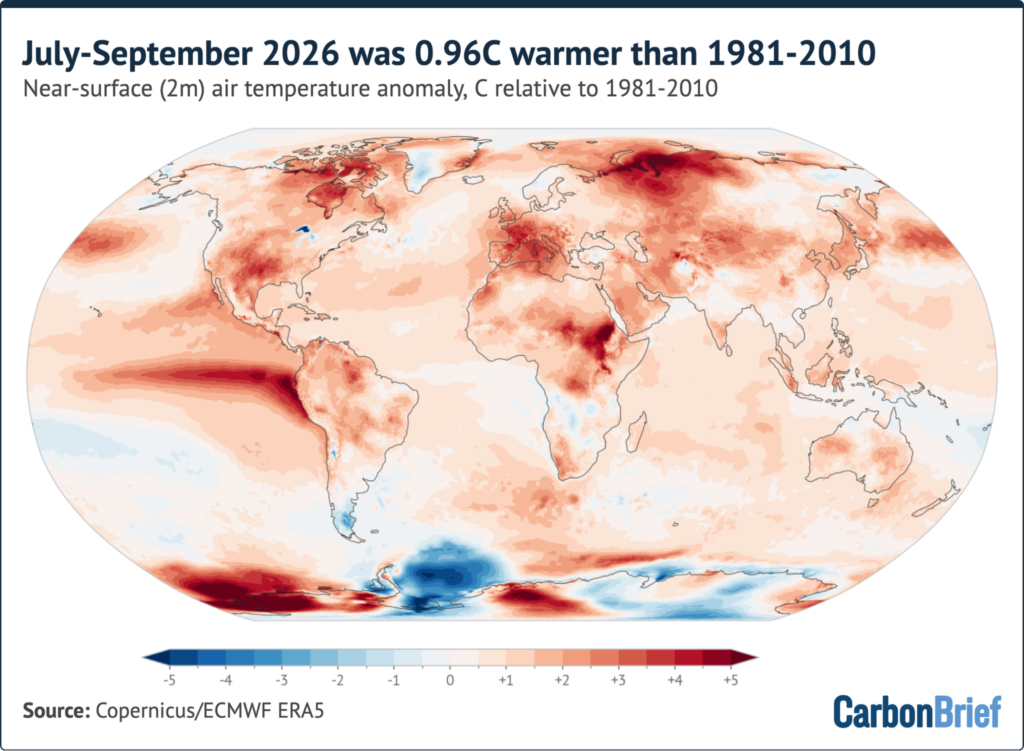
The El Niño shows up as a stripe of extreme warmth across the eastern and central tropical Pacific, with sea surfaces more than 4C above average off the coasts of Ecuador and Peru. Around 3C above average was measured over France and the western Mediterranean Sea, and exceptional heat also covered North-west Russia, the Canadian Arctic, south-central North America, eastern Africa and parts of west Antarctica. The standout chill was the Weddell Sea sector of Antarctica, more than 2C below average for the season.
Ranking each location against every year in the 1940-2026 ERA5 record turns that map into a scoreboard for the quarter.
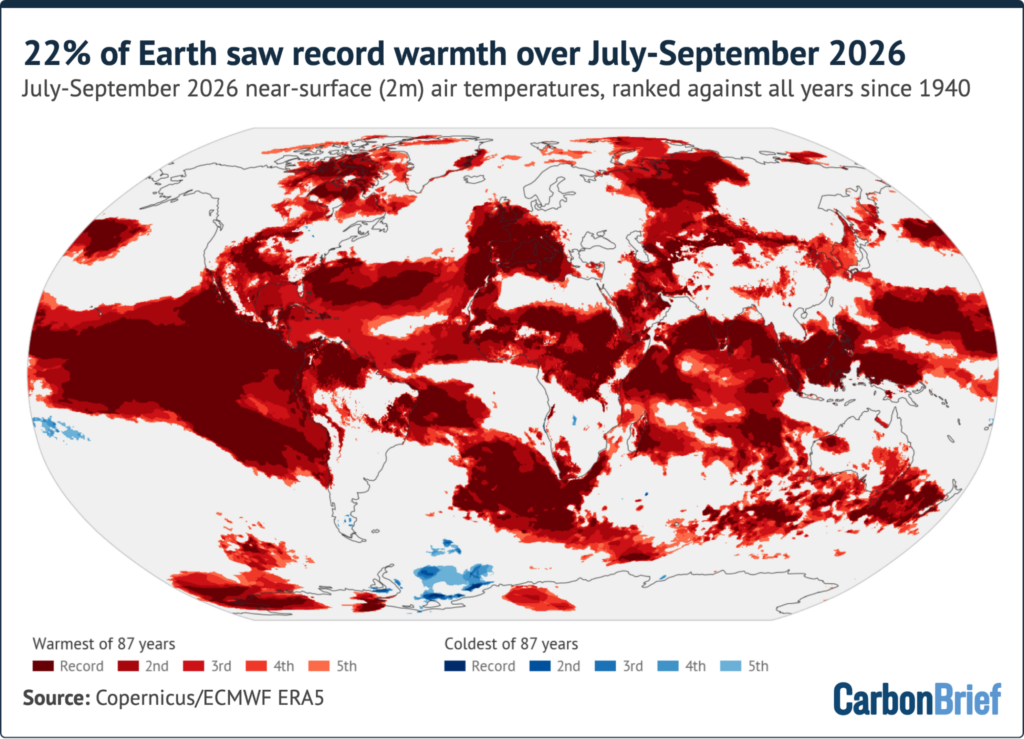
Regions setting hot and cold records for July-September 2026 against all other years since ERA5 begins in 1940. Share of the global surface: 21.5% record warm, 49.9% in the five warmest, 0.5% in the five coldest.
- About 22% of the planet’s surface logged its warmest July-September measured, and roughly half sat among its five warmest.
- Over 90% of the Niño3 and Niño3.4 boxes recorded warmth, alongside 39% of the south Atlantic, 34% of the tropical Indian Ocean and 25% of the subtropical North Atlantic — where 85% of the region ranked in its five warmest.
- On land, some 85% of France and Iberia saw record-warm July-September conditions.
- For September alone, roughly 20% of the world’s surface set a monthly record, and 55 countries broke national September temperature records, among them Chile, Colombia, Italy, Kenya, Nigeria, the Philippines, Portugal, Spain, the United Arab Emirates, the US and Venezuela.
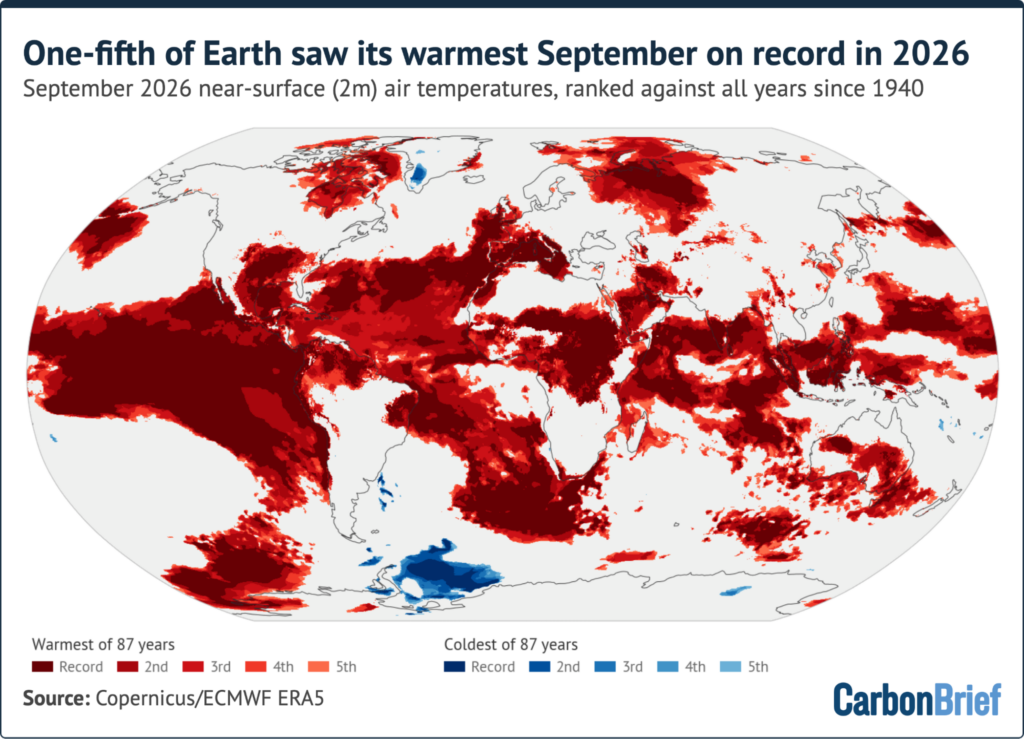
The regional picture, compressed
- Western Europe had its hottest summer measured. Copernicus put the summer mean at 21.7C, 2.5C above the 1991-2020 average and past the benchmark set in 2003, with a record 52% of the continent exposed to “very strong” heat stress by season’s end. Europe overall ranked third-warmest, behind 2024 and 2022. France recorded its warmest July, 3.8C above the 1991-2020 average; Switzerland its hottest summer since records began, averaging 17.2C.
- South-west Europe stayed hot into autumn. Spain had its warmest September, 3.4C above the 1991-2020 average, clearing the 1987 record by an unusually large 0.7C.
- Water and fire followed the heat. River flows across Europe fell to their lowest summer levels since the European Flood Awareness System record opened in 1992, and by early September the area burned across the EU was close to double the 2006-25 average for that point in the season.
- North America. The contiguous US had its hottest summer measured and its warmest September, with drought touching around 59% of the country.
- Monsoon. India’s monsoon, which typically weakens during El Niño years, finished 12.6% below normal — the driest in 11 years.
- Storms. Development was suppressed in the Atlantic while the Pacific saw a record number of tropical cyclones.
- Sea ice. The Arctic minimum tied for its 10th lowest in the satellite record; Antarctic sea ice reached only its third-lowest winter peak.
Step 5: Retire these five misconceptions
- “A year above 1.5C means the Paris Agreement has failed.” It does not. The pledge is measured as a long-term average, not a single season. Carbon Brief’s model does give 2026 a 93% chance of exceeding 1.5C in the six-dataset average — which would make it the second such year after 2024 — but not in every individual dataset.
- “Agencies disagree, so the trend is unreliable.” They agree on direction and on sequence. All six ranked the first nine months of 2026 second-warmest behind 2024; they differ by hundredths of a degree in how they fill empty grid boxes.
- “El Niño is warming the planet.” It moves heat between ocean and atmosphere. The sustained rise traces to emissions, and to that doubled energy imbalance noted above.
- “January will settle it.” Expect a split verdict. In January 2015, NASA and NOAA reported that 2014 was most likely the warmest year, while the Met Office characterised it as level with 2010. Something comparable may occur in January 2027.
- “67% is a firm number.” It rests on an extrapolation. The October-December El Niño forecast lies beyond anything in the record used to train the statistical model, so the projection assumes that the historical link between Niño3.4 strength and global temperature survives an event of this size. If this El Niño’s warming effect turns out no larger than that of past champions, record odds for the year drop nearer 50%.
Step 6: A monitoring checklist through January 2027
Carbon Brief’s headline projection combines observations through September with current El Niño forecasts, using a statistical model trained on the historical relationship between year-to-date temperature, ENSO state and the annual result. The arithmetic is simple enough to track yourself:
- Best estimate for 2026: around 1.52C above pre-industrial levels, 90% range of 1.50C to 1.55C — a shade above, and effectively level with, the 1.52C of 2024, and nudged up from the 1.51C in the July round.
- Berkeley Earth: 2026 runs only about 0.03C below 2024 over January-September, so its final quarter needs to beat 2024 by roughly 0.08C.
- ERA5: about 0.09C behind over the same span, demanding October-December warmth around 0.27C above 2024’s closing quarter.
- 2027: median near 1.74C, wide 90% band of 1.54C to 1.95C, 96% chance of a record, and a 98% chance that at least one of 2026 or 2027 sets one.
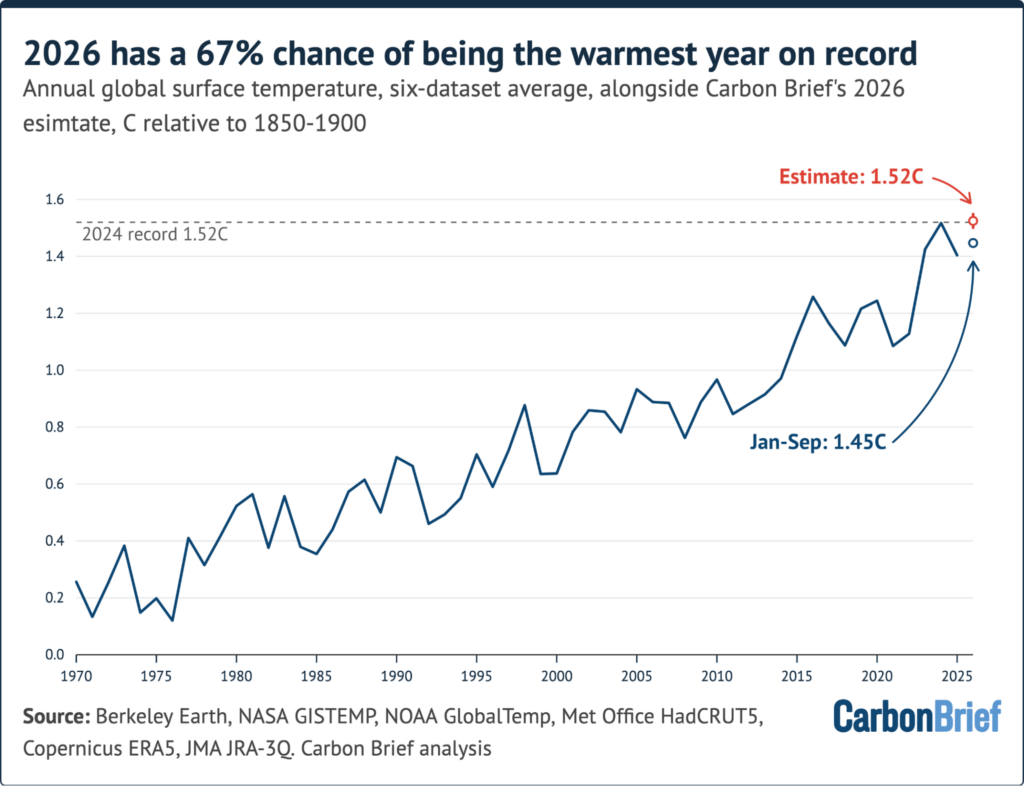
Six-dataset annual average since 1970, with the January-September 2026 figure, the 2026 estimate and its 90% range; the dark red dot marks the median 2027 projection, the bar the 50% range and the line the 90% range.
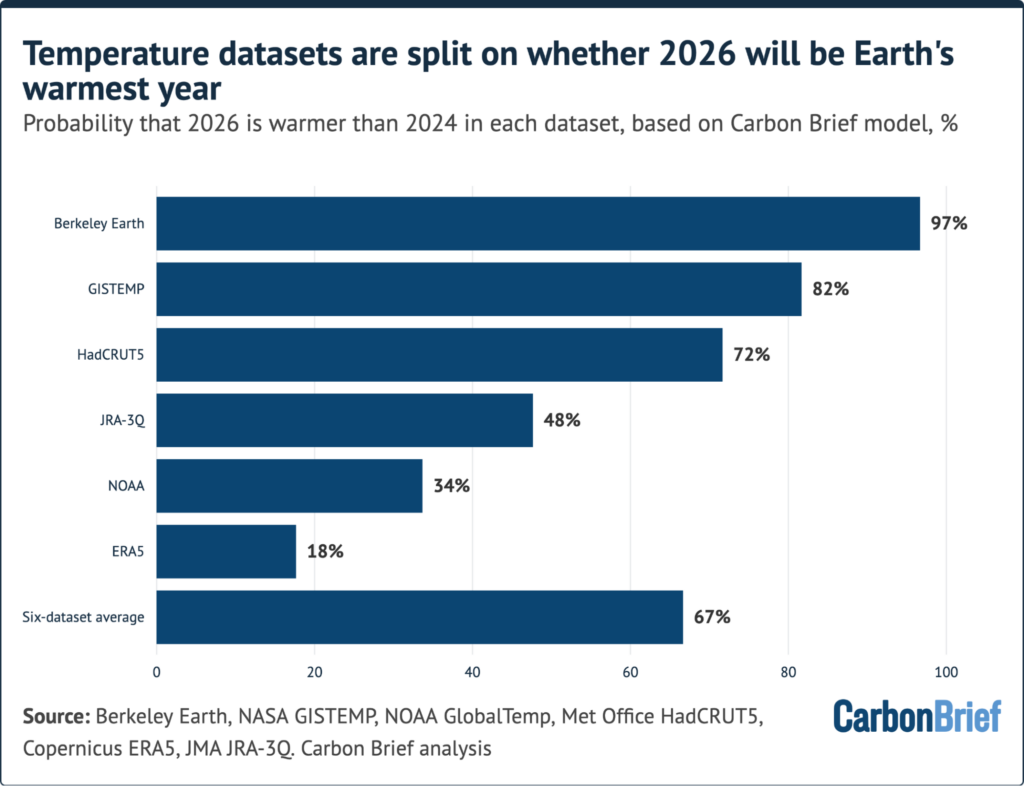
Likelihood of a 2026 record by dataset under Carbon Brief’s model, each run against its own observations and own record; the HadCRUT5 figure uses data only through August.
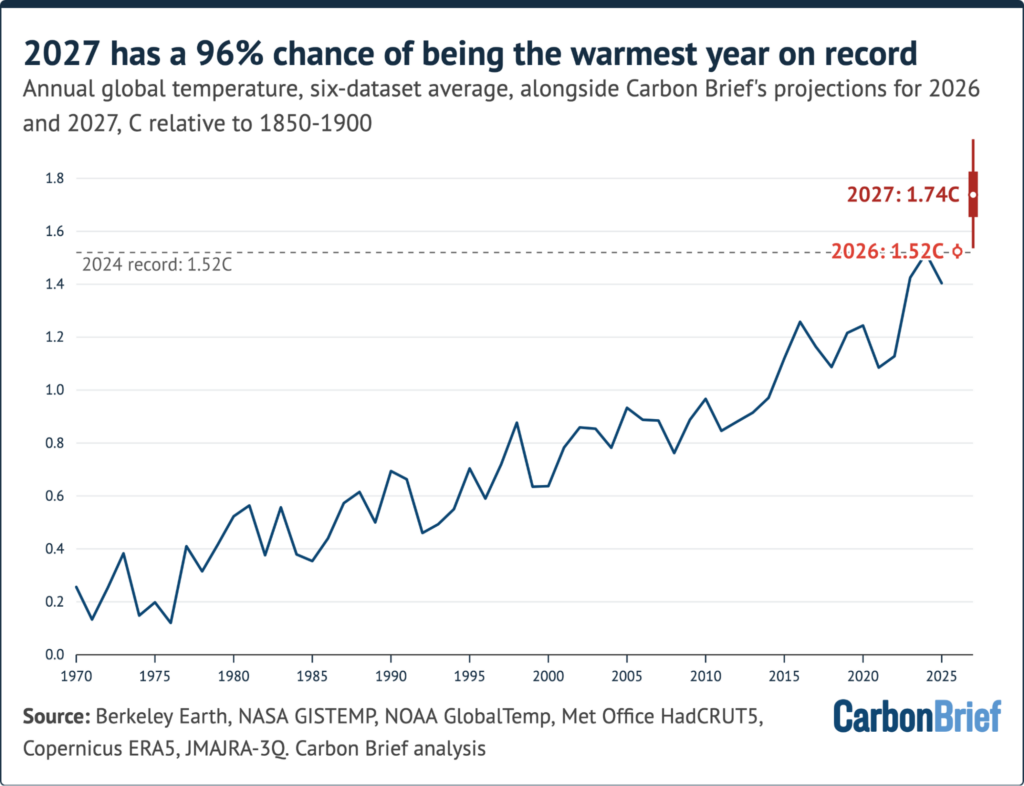
Six-dataset averages since 1970 with projections for 2026 and 2027; for 2027 the dark red dot is the median, the bar the 50% range and the line the 90% range.
Between now and the announcements, five checkpoints carry most of the information:
- Daily Niño3.4 anomaly against the November 2015 benchmark — a fall back below it would signal the event is peaking early.
- Peak timing in the model pool: December versus November shifts where the three-month lag lands.
- Monthly NOAA and IRI guidance — read the labelled phase, not the colour of a map.
- HadCRUT5’s September release, which should pull its 72% figure into a firmer band.
- October-December observations, which decide whether the closing quarter beats the equivalent 2024 months by the margins above.
Step 7: From forecast to household and business decisions
Treat the record question as trivia and the seasonal footprint as the usable product. NOAA notes that a strong El Niño shifts the Pacific jet stream, which is what steers temperature and precipitation across North America and redirects storm tracks — historically wetter-than-average conditions in the southern US and warmer, drier air across the north (see noaa.gov’s “Understanding El Niño & ENSO”). Practical response, ordered by lead time:
- Now, before winter. If your property sits in a region the drought statistics above touch, audit water use, outdoor fire risk and irrigation before the season closes. Southern US locations should plan for a wetter, more active storm window.
- Heat resilience. Western Europe’s summer figures — 21.7C seasonal mean, 52% of the continent under “very strong” heat stress — describe the conditions, not the emergency. Build a cool room, confirm what your policy covers for heat-related damage, and check which medicines need refrigeration. Public preparedness checklists from institutions such as Oregon State University’s health services structure the same advice as before / during / after, which is a useful discipline.
- Bill and budget exposure. Both a record-hot summer and a mild, dry northern US winter move household energy demand; the 2026 to 2027 sequence is a plausible year for two consecutive load spikes.
- Procurement and pricing. A monsoon shortfall of 12.6% in India and drought across 59% of the contiguous US are supply-side signals for rice, sugar, spices and livestock feed; buyers who wait for the January verdict will be reading about price moves that already happened.
- Media literacy. When two agencies split in January, quote the range and the source, not the loudest single figure.
FAQ
Which datasets will probably call 2026 the record year?
Berkeley Earth at 97% and NASA GISTEMP at 82% are the strong cases. HadCRUT5 currently reads 72% on incomplete data, JRA-3Q 48% and NOAA 34% are effectively toss-ups, and ERA5 at 18% leans against a record.
Is 2026 already confirmed as the hottest year?
No. The best estimate of about 1.52C is essentially level with 2024, and the 67% figure quantifies a race rather than a result. What is close to settled is that the year ends in the top two, and that the 2020s have now produced the warmest years measured.
Why does 2027 look worse than 2026?
Timing. With global temperatures trailing the tropical Pacific by roughly three months, an event peaking around the end of 2026 pushes its maximum influence into the following calendar year, exactly as the 2015-16 event did for 2016. Carbon Brief’s 2027 line sits near 1.7C above pre-industrial levels, with a 96% chance of a new record.
Where can I verify any of this myself?
The primary series are public: GISTEMP tables at data.giss.nasa.gov, NOAA’s climate monitoring, Berkeley Earth’s monthly files, Copernicus/ECMWF’s ERA5, the Met Office Hadley Centre’s HadCRUT5 and the Japan Meteorological Agency’s JRA-3Q. Earth’s energy imbalance comes from NASA’s CERES record, and a peer-reviewed NASA-led assessment of that trend is available through the National Centers for Environmental Information research library.
Judged as decision support rather than as a scoreboard, the current picture is unusually actionable. The driver is documented, the timing is understood, the disagreement between products is a matter of method rather than of direction, and the remaining unknown — who wins the annual title — is worth less to you than the quarter of weather that produced it. Watch the Niño3.4 numbers through winter, verify each agency’s release when it lands in January, and build your plans around the seasonal footprint rather than the ranking.
Questions about this guide or a request for the underlying dataset links? Readers of IT Insights can reach the editorial desk at contact@itinsights.com.